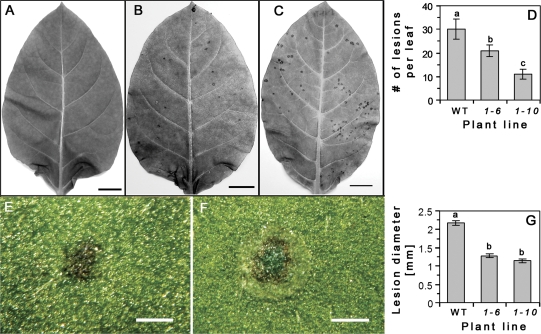
Fig. 8.
Source leaves of AtRGP2:GFP transgenic and WT tobacco plants inoculated with TMV, at 4 dpi. Dry lesions are present on representative leaves (5th or 6th from the base): transgenic line 1-6, mock inoculated (A) and virus-inoculated (B); and WT, virus-inoculated (C). The number of lesions is lower on transgenic leaves than on WT (D). (E, F) Characteristics of representative lesions from transgenic line 1-6 (E) and WT (F) on 4 dpi as viewed from the adaxial surface. Lesions on transgenic plants have an irregular shape, lack a chlorotic ring and central chlorophyll concentration (E), and are smaller in size than WT (G). Lesions on WT leaf are regular round-shaped, have three distinctive regions: chlorotic and necrotic rings and central chlorophyll concentration (F). Values represent: in (D), means ±SE of average of two leaves per plant, from 13 WT and 16 transgenic (8 from each line) individual plants; in (G), means ±SE of lesion diameter (n=32–41) of randomly chosen infected leaves. Lowercase letters in (D) and (G) indicate statistical differences at P <0.05 in (D), and at P <0.0001 in (G), as determined by Student's t test. Bar=2 cm (A–C); 1 mm (E, F).

