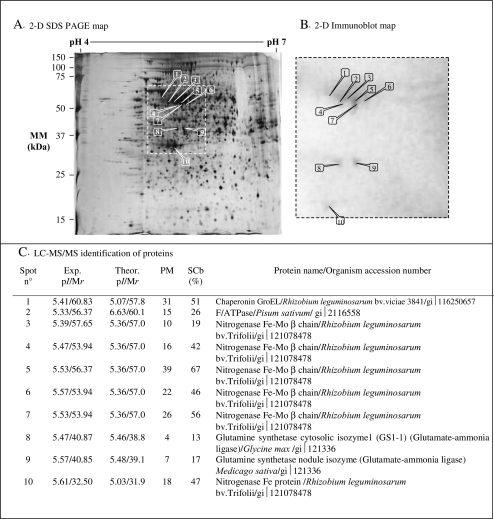
Fig. 3.
Proteomic maps of nodule proteins from white clover plants grown for 140 d at three sulphate concentrations in the nutrient solution (0, 0.095, and 0.380 mM). (A) Nodule proteins were separated by 2-D SDS-PAGE (12% acrylamide) and stained with silver nitrate. (B) Nodule proteins were revealed after immunoblot with anti-NifH. Immunodetected spots are numbered from the highest to the lowest molecular mass. (C) Identification of nodule proteins immunodetected by the anti-FeMoCo-nitrogenase antibodies. Experimental and theorical pI and molecular mass are indicated as Exp. and theor. pI/Mr. The assigned protein of best match is given with the organism in which it was identified and its GenBank protein accession number: PM: number of LC-MS/MS matched peptides, SCb (%): percentage of sequence coverage of the protein.

