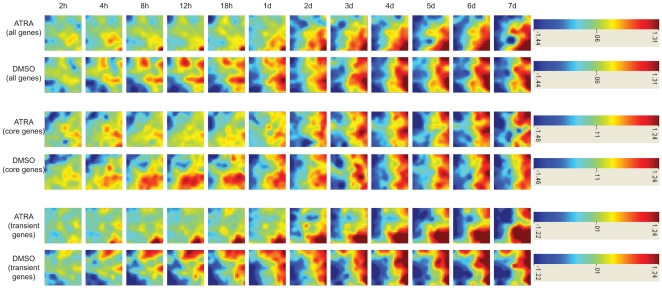
Figure 4. Gene expression mosaics of the ATRA and DMSO-stimulated time course data.
The expression mosaics for the ATRA and DMSO-stimulated time course data capture spatial patterns in the data as the system iterates through the time series. These images are a graphical representation of dynamic expression changes in the data, clustered using a self-organizing map algorithm (SOM). We show how the overall expression trajectories for the ATRA and DMSO-stimulated data can be divided into components defined by the core and transient set of genes. Red denotes extreme positive log expression ratios, blue denotes extreme negative log expression ratios.

