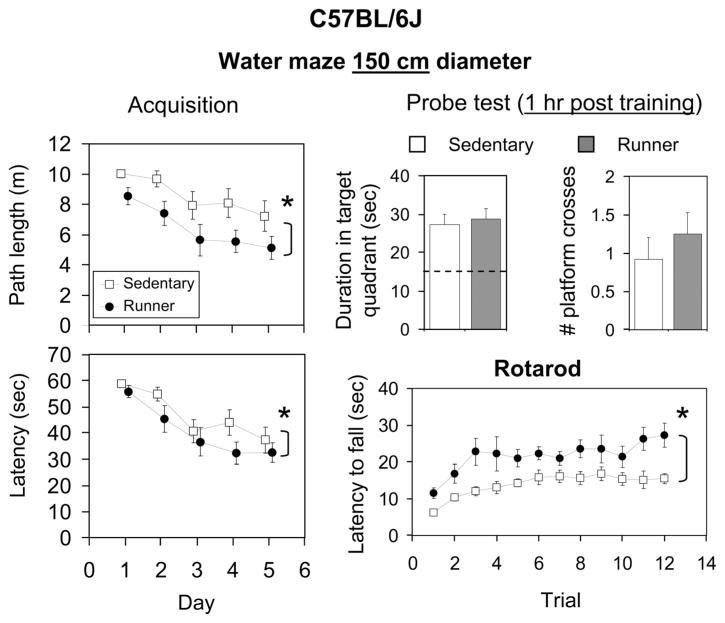
FIGURE 5.
Effects of exercise on behavioral performance in C57BL/6J mice. Runners (filled symbols, filled bars) are shown separately from the sedentary group (open symbols, open bars). For water maze (150 cm diameter), acquisition, mean path length (m), and latency (s) across days are shown. For the water maze probe trial (1 h after the last training trial), mean duration in the target quadrant (s) and number of crossings through the platform location are shown. For rotarod, mean latency (s) to fall on each of 12 trials (four trials per day for 3 days) are shown. Standard error bars are shown throughout.

