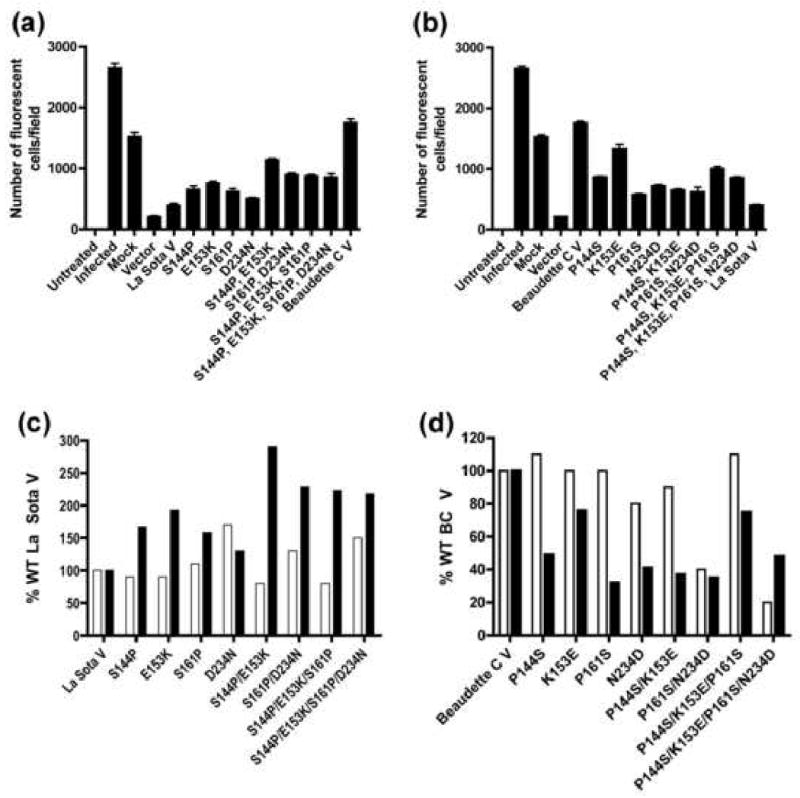
Fig 3.

Effect of wt and mutated V proteins on the growth of NDV-GFP virus. DF1 cells were mock-transfected (mock), or transfected with empty vector (vector), La Sota wt or mutated V plasmids (panel A) or BC wt or mutated V plasmids (panel B). After 24 h, the cells were infected with NDV-GFP at a moi of 0.001 and examined for fluorescence 24 h later. In panels C and D, the percent expression relative to wt (open bars) is shown for mutated LaSota (panel C) and BC V proteins (panel D), along with the percent of wt rescue of growth of NDV-GFP virus (filled bars), based on the data in panels A and B. Expression levels were determined as described in the legend to Fig. 1C. These data represent one experiment out of at least two.
