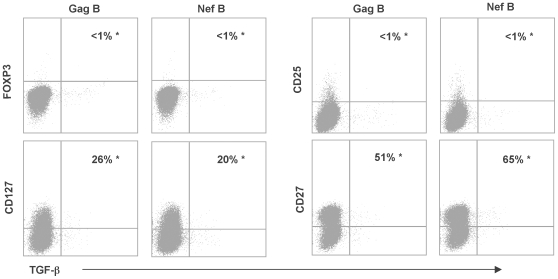
Figure 2. Analysis of regulatory surface markers expression by HIV-specific TGF-β positive CD8+ T cells.
PBMC were stimulated with HIV peptides, then stained for various memory and regulatory markers and the percentage of TGF-β positive CD8+ T cells was determined by flow cytometry. Samples were first gated on the CD3+/CD8+ lymphocyte population and then the percentages of TGF-β positive cells were determined and the extent of FOXP3, CD127, CD25, and CD27 expression was also examined. Gating was performed using the fluorescence-minus-one (FMO) control for each marker. Representative plots of the phenotype of the HIV-specific CD8+ T cells expressing TGF-β. The values marked with an asterisk represent the fraction of TGF-β positive cells that express FOXP3, CD127, CD25, or CD27 over the total number of TGF-β positive cells (equivalent to 100%).

