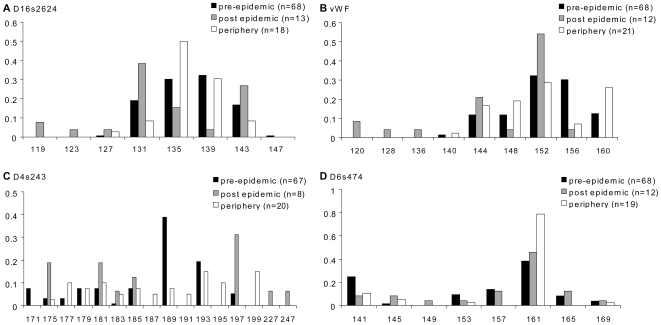
Figure 3. Distribution of allele frequencies of the loci showing significant temporal and spatial changes in Lossi.
The pre-epidemic (black bars), post-epidemic (grey bars) and periphery (hatched bars) allele frequencies distribution are presented for the two loci with significant Waples' neutrality tests when comparing pre and post epidemic samples (A and B) and for the two loci with significant homogeneity tests when comparing pre, post epidemic and periphery samples (C and D). n: number of individuals typed for the locus.

