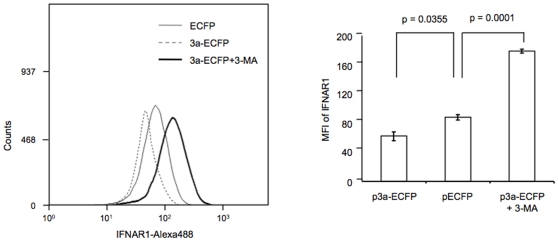
Figure 6. The 3a protein reduces endogenous levels of IFNAR1.
Huh7 cells in 60 mm dishes were transfected with 2.5 µg of either pECFP or p3a-ECFP. In one set, the p3a-ECFP transfected cells were also treated with 20 mM 3-MA for 1 hr prior to harvest. The cells were harvested 48 hr post-transfection and endogenous levels of IFNAR1 were analyzed by flow cytometry as described in Materials and Methods. The mean fluorescence intensity (MFI) of IFNAR1 signal was estimated and p values shown were calculated with the Student's T test. The flow cytometry plot is representative of three separate experiments, while the MFI values shown are an average (±SD) of these experiments.

