
Figure 2.
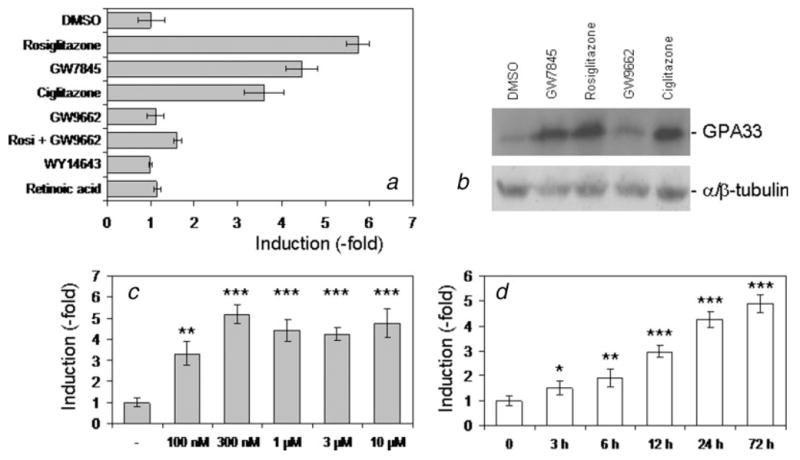
Characterization of GPA33 induction in HT29-Cl.16E. HT29-Cl.16E colon cancer cells were treated with different ligands for 24 hr. GPA33 expression was measured by real-time PCR and normalized to GAPDH (a). Proteins extracted from treated cells were analyzed by Western blotting using the A33 antibody. The α/β tubulin antibody was used as a loading control (b). HT29-Cl.16E colon cancer cells were treated with rosiglitazone at the indicated concentration for 24 hr (c), or with 10 μM for the indicated time (d). RNA was extracted and analyzed by quantitative RT-PCR. (*p < 0.05; **p < 0.01; ***p < 0.001). Results presented are mean ± SD of 3 different experiments.