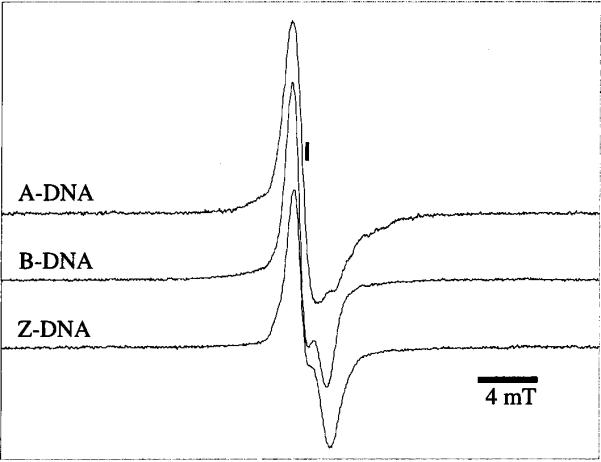
FIG. 1.

Single-scan 40 mT Q-band EPR spectra taken at 4 K of poly-crystalline A-DNA d(GCGGGCCCGC) (II) after a dose of 22 kGy (top spectrum), polycrystalline B-DNA d(CGCGAATTCGCG) after a dose of 17 kGy (middle spectrum), and polycrystalline Z-DNA d(CGCGCG) (I) after a dose of 22 kGy (bottom spectrum). The position of g = 2.0023 is indicated by the vertical line.
