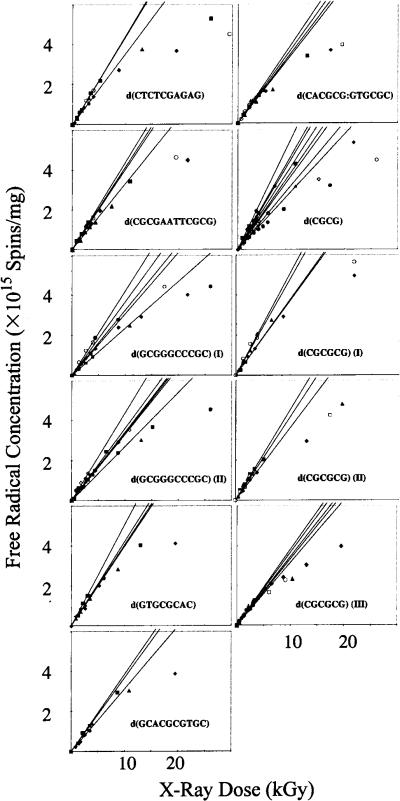
FIG. 2.
Free radical concentration as a function of X-ray dose for 11 different crystalline systems irradiated and measured at 4 K. The initial slopes of the individual data sets using the linear region of the data <5 kGy are plotted. From the slopes of these lines, we determine the free radical yields of the crystalline DNA samples.

