
Fig. 3.
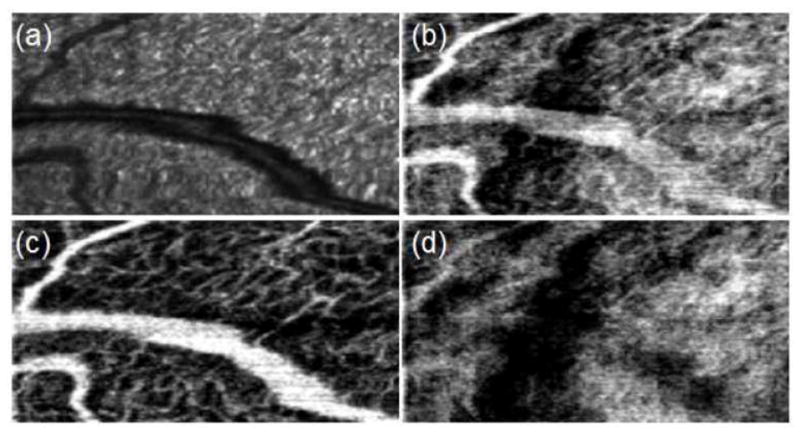
1 mm x 0.5 mm OCT retinal summation images. (a) Intensity summation image summed over entire image depth, analogous to fundus images. (b) Motion contrast summation image summed over the entire image depth. Motion contrast data are separated into summation images over the (c) retinal and (d) choroidal depth regions. Microvasculature is clearly observed within the retinal motion contrast summation image.