
Fig. 4.
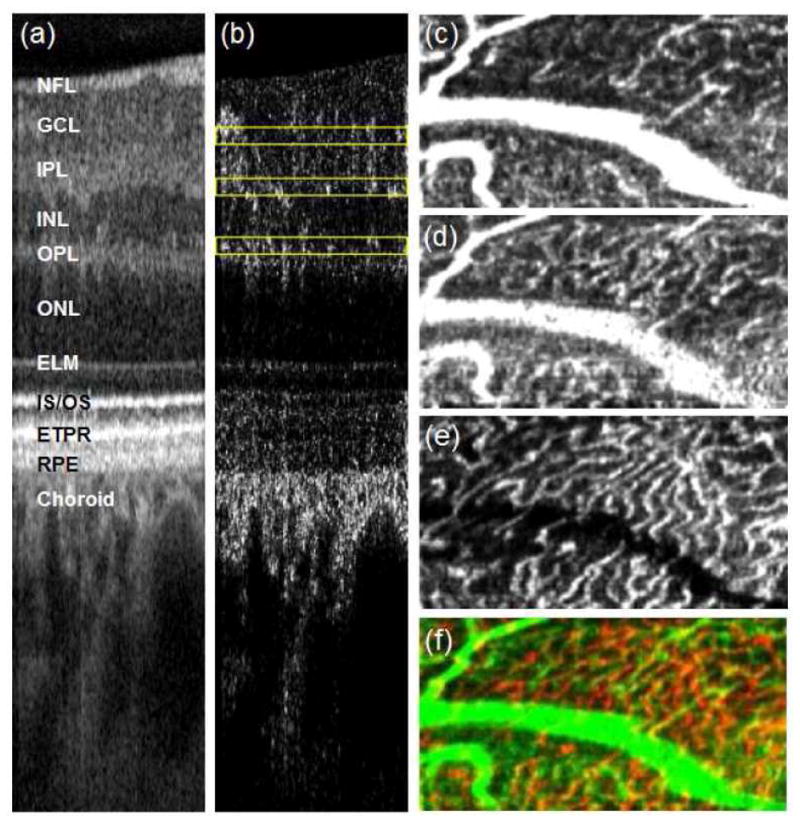
1 mm x 0.5 mm OCT summation images, using the same data presented in Fig. 2. (a) Intensity and (b) motion contrast B-scans demonstrate the depth regions (yellow boxes) which are summed to create the individual vascular layer images. The motion contrast summation images of 16 μm thickness located at depths of approximately (c) 60 μm, (d) 100 μm, and (e) 150 μm below the anterior surface of the retina. (f) Composite vascular image composed of the average of images (c) and (d) (in green) overlaid with image (e) (in red). Specifics on retinal layer labeling can be found within reference [25].