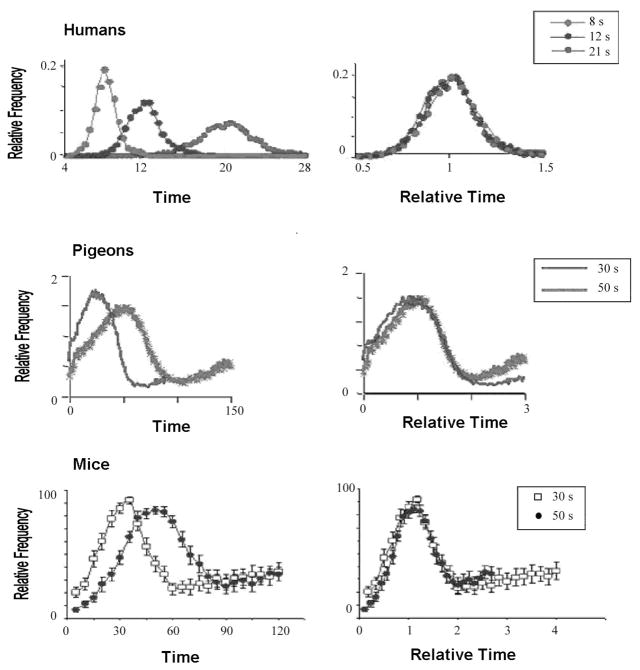
Figure 3.
Timed anticipation in humans (modified from Rakitin et al., 1998, with permission), pigeons (from Gibbon, Fairhurst & Goldberg, 1997 with permission), and mice (from Brunner, personal communication with permission) shows the scalar property. The left panels show mean response rate as a function of absolute time in the interval, the right panels show mean percentage of maximum response rate as a function of relative time in the interval. The superposition of the relative response rate distributions shows the scalar property- the standard deviation of the distributions increases linearly with the mean.

