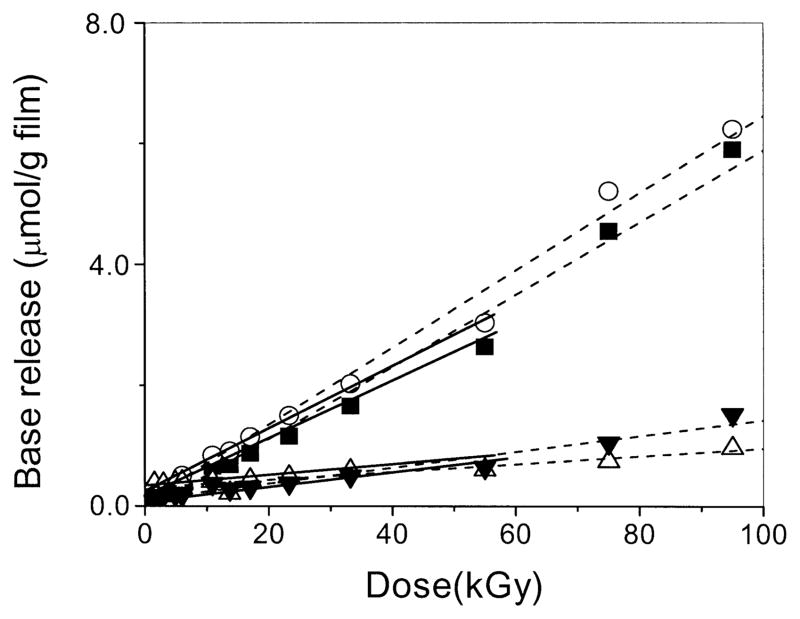
FIG. 3.
Dose–response curves for the release of cytosine (■), guanine (○), thymine (△) and adenine (▼;) from d(GCACGCGTGC)2 films X-irradiated at room temperature under air. The broken lines show the linear fit from 0–95 kGy, and the solid lines show the linear fit to the data <60 kGy. There was no statistically significant difference between the slopes of these two fits, demonstrating that high-dose points remain in line with low-dose points. The slope of the latter was used to determine the chemical yields reported in Table 2.

