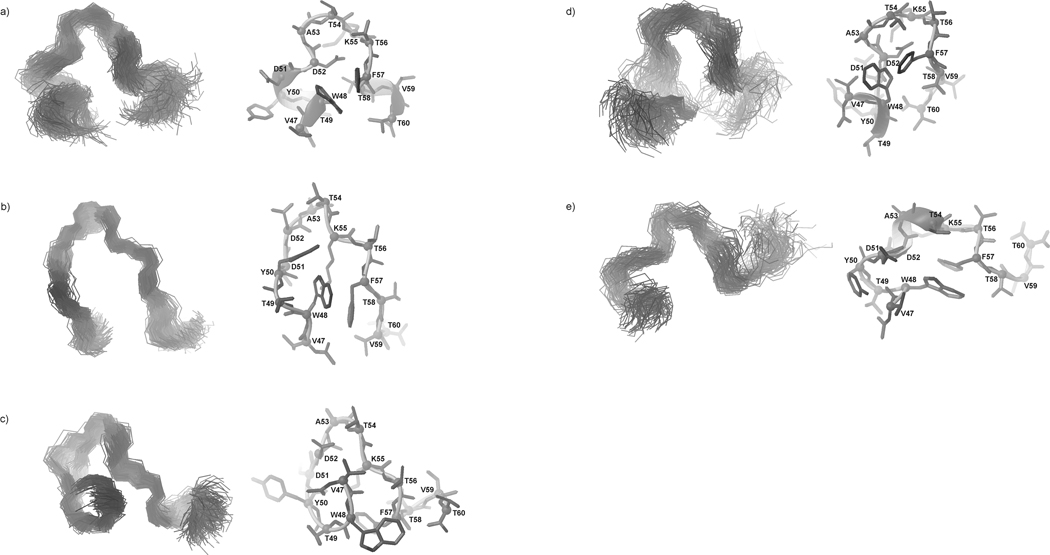
Fig. 15.
Five families of clustered conformations of IG(47–60) obtained by using time-averaged MD methodology with restraints from NMR measurements at 283 K. Left columns show all conformations from a family (only backbones are shown for clarity), right columns show the lowest energy conformation from the corresponding family (all heavy atoms are shown). 1200 conformations were subjected to a cluster analysis, leading to the following numbers and percentages of each clustered family: (a) 373 (31.1%), (b) 300 (25%), (c) 300 (25%), (d) 131 (10.9%), (e) 96 (8%).

