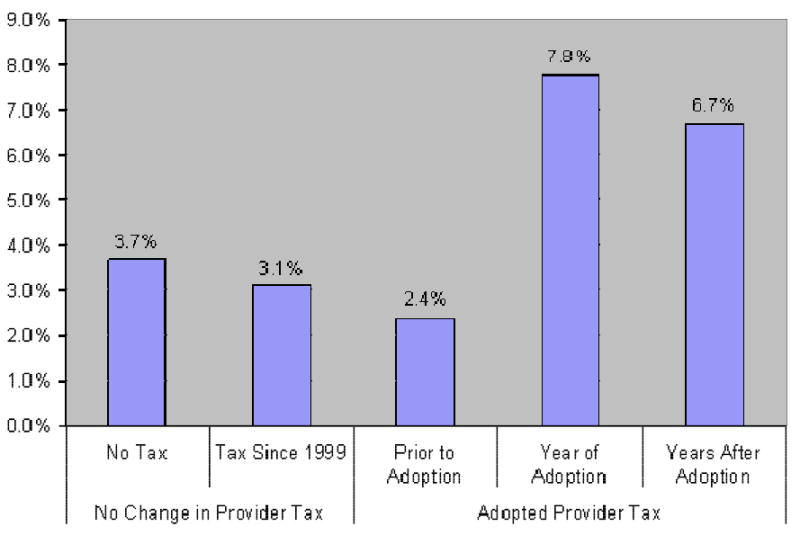
Figure 3. Average Annual Growth in Inflation-adjusted Medicaid Nursing Home Payment Rates With and Without Provider Taxes (1999-2004).

SOURCE: Data collected by the authors. New York and South Carolina are excluded, because they repealed an existing provider tax over the 1999-2004 period.
NOTES: The Consumer Price Index (U.S. city average of all items for all urban consumers, obtained from the Bureau of Labor Statistics, U.S. Department of Labor) was used to adjust the nominal rates to constant dollars.
