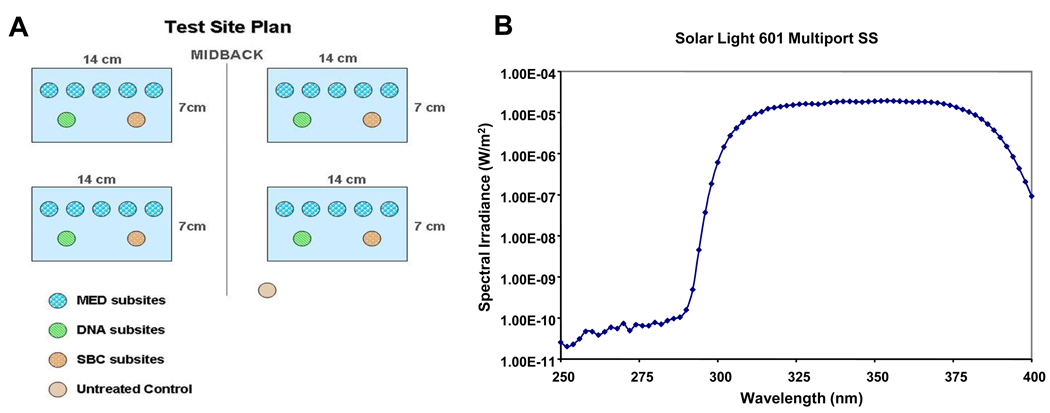
Figure 1.
A. The test site plan for the four treatment areas with the respective subsite locations used in this study. B. Emission spectrum of the SSR source. The signal below 300 nm is slightly above the noise level of the spectroradiometer but is very low, 6 orders of magnitude below the peak intensity level (note this is on a semi-log plot).

