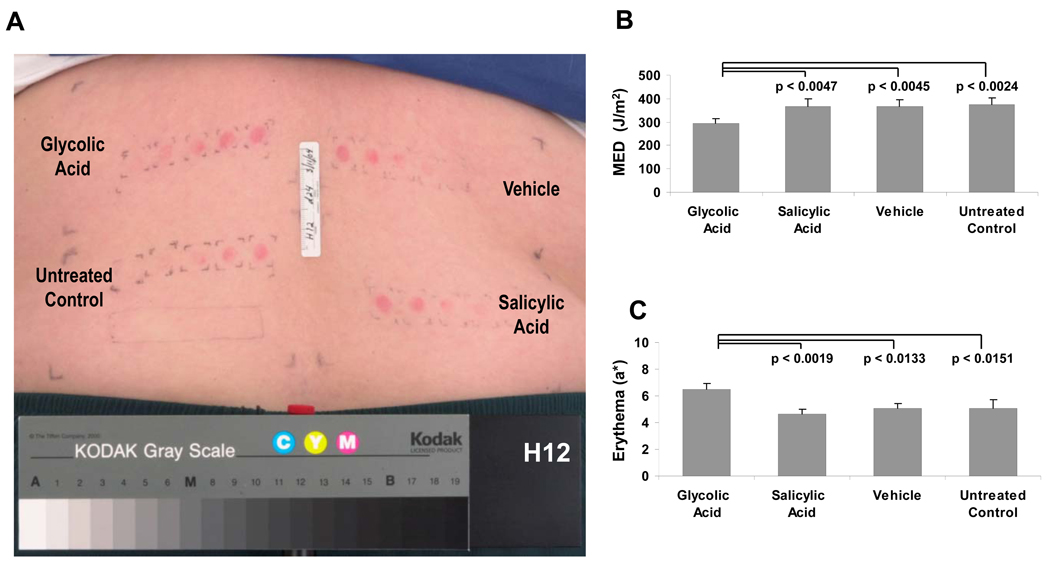
Figure 2.
A. A typical example of erythema development within the four test sites 24 hours after SSR exposure on day 24. B. The MED was determined for the 4 treatment sites on each subject. An average of the subjects’ MED at each site was calculated (n=14). C. Changes in erythema after SSR using the Minolta spectrophotometer to calculate the chromametric a* parameter. Sites identified for biopsy and determination of sunburn cells were irradiated as described in Materials and Methods. Data are reported as means ± SEM (n=14); NS = not significant; p values shown are for comparisons to glycolic acid treatment

