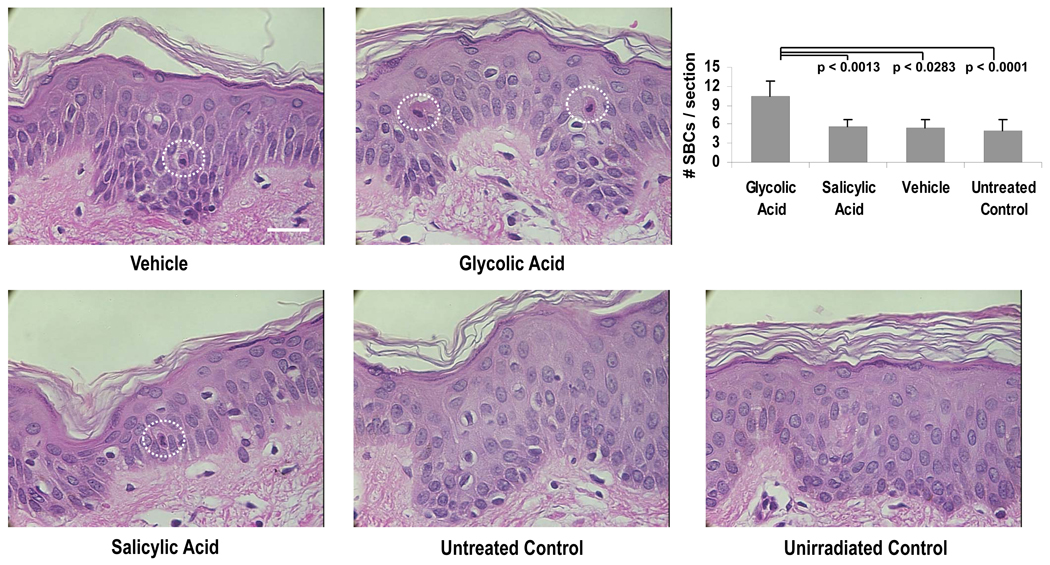
Figure 4.
Representative images of specimens stained for SBCs (dashed circles) at the UV-exposed sites and at the control unirradiated site (taken from subject H12). Graph shows numbers of SBCs per section in all the test site areas (n=12). Data are reported as means ± SEM; NS = not significant; p values shown are for comparisons to glycolic acid treatment. All images at the same magnification; bar = 25 µm

