Abstract
Rationale and Objectives
To investigate the feasibility using quantitative morphology/texture features of breast lesions for diagnostic prediction; and to explore the association of computerized features with lesion phenotype appearance on MRI.
Materials and Methods
43 malignant/28 benign lesions were used in this study. A systematic approach from automated lesion segmentation, quantitative feature extraction, diagnostic feature selection using artificial neural network (ANN), and lesion classification was carried out. Eight morphological parameters and 10 GLCM (gray level co-occurrence matrices) texture features were obtained from each lesion. The diagnostic performance of selected features to differentiate between malignant and benign lesions was analyzed using the ROC analysis.
Results
Six features were selected by ANN using leave-one-out cross validation, including Compactness, NRL Entropy, Volume, Gray Level Entropy, Gray Level Sum Average, and Homogeneity. The area under the ROC curve was 0.86. When dividing the database into half training and half validation set, a classifier of 5 features selected in the half training set achieved AUC of 0.82 in the other half validation set. The selected morphology feature “Compactness” was associated with shape and margin in BI-RADS lexicon, round shape and smooth margin for the benign lesions and more irregular shape for the malignant lesions. The selected texture features were associated with homogeneous/heterogeneous patterns and the enhancement intensity. The malignant lesions had higher intensity and broader distribution in the enhancement histogram (more heterogeneous) compared to the benign ones.
Conclusion
Quantitative analysis of morphology/texture features of breast lesions was feasible, and these features could be selected by ANN to form a classifier for differential diagnosis. Establishing the link between computer-based features and visual descriptors defined in BI-RADS lexicon will provide the foundation for the acceptance of quantitative diagnostic features in the development of computer-aided diagnosis (CAD).
Keywords: Artificial Neural Network, Breast MRI, Computer Aided Diagnosis, Lesion Characterization, BI-RADS
Dynamic contrast enhanced MRI (DCE-MRI) has evolved into an established clinical imaging modality for detection and diagnosis of breast lesions. The American Cancer Society has issued a guideline recommending annual breast MRI screening for women with lifetime breast cancer risk greater than 20–25%. Breast MRI has demonstrated a high sensitivity, however, with varied specificity, 37%–97% reported in the literature [1–6]. The high false positive finding may lead to unnecessary biopsies or over treatment. As the use of breast MRI increases, the accuracy and efficiency in interpretation becomes a challenging issue. Development of a computer-aided diagnosis (CAD) system for breast MRI may provide a practical help, particularly to mammographers who have limited experience on breast MRI.
The CAD for mammography is by far the most mature among all medical imaging analysis systems. It detects abnormalities or suspicious regions, and marks them with different labels indicating different features with varying degrees of malignancy [7–10]. A great deal of research has also been spent on developing CAD for breast ultrasound [11–13]. Given the many more images acquired in MRI compared to mammogram and ultrasound, development of breast MRI CAD is far more challenging, but on the other hand will be very helpful. The currently existing commercial CAD systems for breast MRI, such as CADstream (Confirma Inc. Kirkland, WA) and fTP (CADsciences, White Plains, NY) provide display platforms to show various presentations of the enhanced lesions to assist radiologists’ interpretation. The display is mainly based on the enhancement kinetic features, such as the wash-out patterns, of voxels with the percent enhancement above a pre-set threshold. The morphological features as defined on BI-RADS lexicon [14], as well as the final diagnostic impression, will have to be evaluated by radiologists.
The properties in the enhancement kinetics of lesions measured by DCE-MRI, either using fitting parameters from pharmacokinetic models or raw enhancement data, have been extensively investigated. On the other hand, the work in quantitative morphological analysis of lesions is much less, partly due to the difficulty in defining relevant quantitative parameters that could characterize benign and malignant lesions. Some effort has been spent on exploiting computer-assisted approaches. Gihuijs et al. employed computer algorithm analysis of shape-based features from reconstructed 3-dimensional (3D) lesions [15]. Gibbs et al. reported significant differences in the GLCM (Gray Level Co-occurrence Matrices) texture of benign and malignant lesions in breast MRI [16]. These two studies demonstrated that quantitative analysis of shape- or texture- based features may be used for differential diagnosis. However, the manual lesion segmentation employed there would limit the development of this technique to build an automated CAD.
Several studies have employed computer algorithms for automated lesion segmentation. Liney et al. used region growing to outline lesion and investigate the diagnostic power of shape-based features [17]. Chen et al. also applied region growing to segment lesions and then evaluated the kinetic features [18]. Later Chen et al. proposed another lesion segmentation method using fuzzy c-means algorithm (FCM), and reported that the performance using FCM is more reliable than using region growing [19]. They also applied this technique to automatically search the hot spot and analyze its enhancement properties [20]. A systematic statistical analysis may be used to select an optimal set of features to achieve the highest diagnostic accuracy [21].
Based on these previously published works, the first aim of this study is to build a systematic diagnostic platform to differentiate between malignant and benign lesions, from computerized lesion segmentation, quantitative feature extraction, diagnostic feature selection, and lesion the classification. The lesion segmentation was performed using a clustering-based algorithm based on operator-defined location, and then a full panel of quantitative morphological and texture descriptors was obtained for lesion characterization. The artificial neural network (ANN) was employed to select features to form the classifier for differentiating between benign and malignant lesions. The diagnostic performance of the selected classifier was evaluated using the receiver operating characteristics (ROC) analysis. A recent review paper published by Beherns et al. pointed out that for these computer-extracted features to be accepted, the link with morphology descriptors defined in BI-RADS lexicon needs to be established [22]. There has been little work reported in this aspect. The second aim of this study is to explore the association of extracted quantitative features with lesion phenotype appearance on MRI, to provide the initial step towards establishing this link between computer-based quantitative features and BI-RADS visual descriptors.
MATERIALS AND METHODS
Subjects and MRI protocol
The study included 28 histological-proven benign and 43 malignant lesions selected from our breast MRI database collected from 1999 to 2005. The age of the patients was from 29 to 76 years old (48±9, median 48) in the malignant group, and 21 to 74 (45±7, median 45) in the benign group. Only lesions that showed strong contrast enhancements with a clearly defined boundary were selected for this study. Those cases presenting diffuse infiltrating enhancements or ill-defined tumor margin were excluded. Table 1 summarizes the pathology of all analyzed lesions. This study was approved by the institutional review board, and was HIPAA-compliant. All patients gave informed consent to participate in the study.
Table 1.
Histopathology of Benign and Malignant Breast Lesions
| Subtype of Tumors | N | Percentage |
|---|---|---|
| Benign lesions | 28 | |
| Fibrocystic changes | 8 | (29%) |
| Fibroadenoma | 15 | (53%) |
| Others | 5 | (18%) |
| Malignant lesions | 43 | |
| IDC (Invasive Ductal Carcinoma) | 27 | (63%) |
| DCIS (Ductal Carcinoma In-Situ) | 4 | (9%) |
| ILC (Invasive Lobular Carcinoma) | 8 | (19%) |
| Others | 4 | (9%) |
The MRI was performed on a 1.5T scanner using a dedicated 4-channel phased-array breast coil (Philips, Cleveland, OH). The dynamic imaging was performed using a T1-weighted 3D SPGR (RF-FAST) pulse sequence, with TR= 8.1 ms, TE= 4.0 ms, flip angle=20°, matrix size= 256×128, FOV varying between 32 and 38 cm. The temporal resolution for each dynamic acquisition was 42 seconds. Thirty-two axial slices with 4 mm thickness were used to cover bilateral breasts. Four pre-contrast and 12 post-contrast sets were acquired. The contrast agent (Omniscan®, 1cc/10 lbs body weight) was manually injected at the beginning of the 5th acquisition and timed to complete in 15 seconds. The post-contrast enhanced images acquired at the 6th frame, i.e. at 1-min after contrast arrival (adjusting for the delay due to injection time), were used for the analysis to identify the enhanced lesions.
Overall Analysis Scheme
Automated computer algorithms were used to segment and extract features characterizing each lesion. The required procedures include 1-) segmentation of enhanced lesions, 2-) extraction of quantitative parameters for both morphological and texture features, 3)-selection of features using artificial neural networks to form the classifier, and to test its discriminative ability using ROC analysis.
Lesion Segmentation
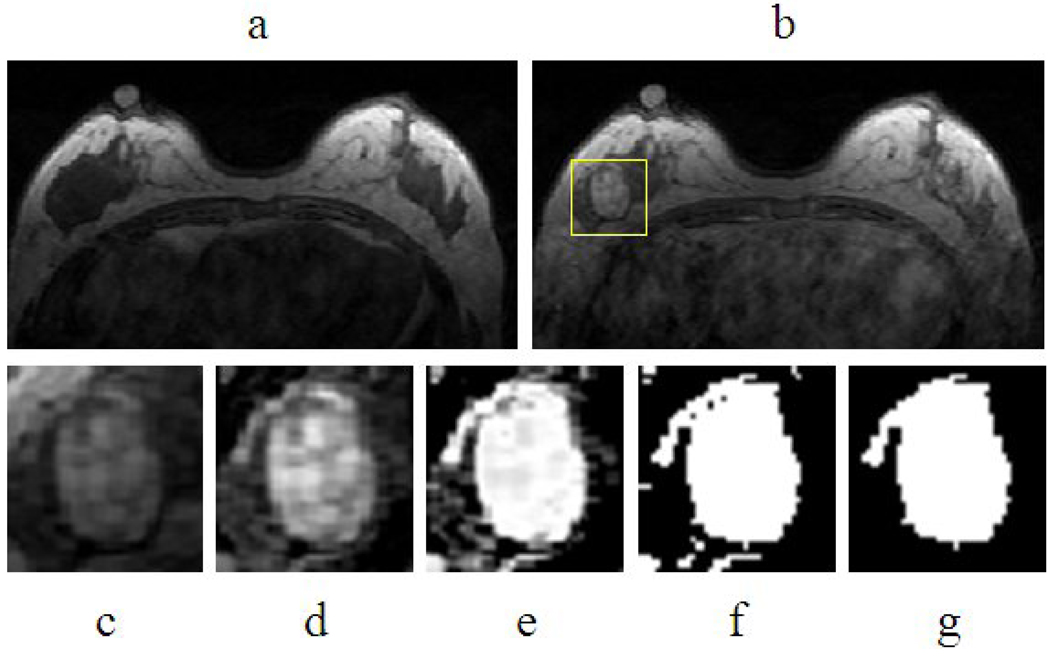
The lesion was segmented from the contrast enhancement maps at 1-min post injection, obtained by subtracting the pre-contrast images taken at the third frame from the post-contrast images taken at the 6th frame. For each lesion, the operator placed an initial ROI indicating the lesion location, and also decided the beginning and ending slices that contained the lesion. Then the outline of the lesion region of interest (ROI) on each imaging slice was automatically obtained using the fuzzy c-means (FCM) clustering based algorithm [19]. The ROIs from all imaging slices containing this lesion were combined to obtain 3D information of the whole lesion. Figure 1 demonstrates an example illustrating the step-by-step procedure. The analysis consisted of these steps: 1) initial square ROI selection placed by a human operator on one imaging slice to indicate the location of the suspicious area; 2) lesion enhancement within the selected ROI using an unsharp filter with a 3 by 3 kernel constructed using the inverse of the two-dimensional Laplacian filter; 3) application of FCM on the enhanced ROI to obtain the membership map of all voxels indicating the likelihood of each voxel belonging to the lesion or the non-lesion cluster. The weighting component on each fuzzy membership is chosen as 2, while the stopping criteria is the absolute change in objective function in consecutive iterations less than a pre-specified number ε =10−5. 4) binarization of the lesion membership map with the selected threshold to separate lesion from non-lesion voxels. The threshold was determined by the operator empirically; and if not satisfactory a different value may be used. 5) 3D connected-component labeling to remove scattered voxels not connecting to the main lesion ROI, and hole-filling to include all voxels contained within the main ROI which were labeled as non-lesion (such as necrotic voxels showing low enhancements). The entire process was performed using programs written with MATLAB 7.0. It took less than 1 second to segment a lesion with size of 4 cm3 on a personal computer.
Figure 1.
Process of lesion segmentation (a) pre- contrast image, (b) post-contrast image, (c) selected square ROI, (d) Unsharp filtered image, (e) Membership map from FCM, (f) Binarized membership, (g) 2-D connected component and hole filling.
The segmentation result obtained using the computerized algorithm was compared to the manual segmentation performed by an experienced radiologist with three years of experience interpreting breast MRI. Using the same lesion location and the beginning and ending slices, the lesion ROI on each slice was manually drawn. It was performed twice, with one-week interval in between. The lesion volume for each case was calculated by counting all voxels contained within the ROI, and multiplying that by the voxel size. The volumes obtained in 2 manual operations were compared, and the averaged volume from 2 manual operations were compared to that of computerized segmentation.
Feature extraction
Morphology features
Eight morphological features including Volume, Surface Area, Compactness, NRL (Normalized Radial Length) mean, Sphericity, NRL entropy, NRL ratio, Roughness (definition given in the Appendix) were calculated to describe the morphological properties. The first three features showed the 3D properties of the lesion. The compactness was defined as the ratio of the square of surface area to the total volume of the lesion. A sphere will have the lowest compactness index. A highly non-convex lesion, such as a spiculated mass, will have a high compactness index. The latter five features were based on the normalized radial length (NRL), defined as the Euclidean distance from the object’s center (Center of Mass) to each of its contour pixels and normalized relative to the maximum radial length of the lesion.
Texture features
Texture is a repeating pattern of local variations in image intensity, and is characterized by the spatial distribution of intensity levels in a neighborhood. Ten GLCM texture features (energy, maximum probability, contrast, homogeneity, entropy, correlation, sum average, sum variance, difference average, and difference variance), as defined by Haralick et al., were obtained for each lesion [23].
Diagnostic Feature Selection
After feature extraction, a total of eight morphological features and ten GLCM texture features were obtained for each lesion. The artificial neural network (ANN) was utilized to obtain an optimal classifier to differentiate between benign and malignant lesions.
The features were selected using LNKnet (http://www.ll.mit.edu/IST/lnknet/) package in order to identify the ones that yield maximum discrimination capability thus achieving the optimal diagnostic performance. Each parameter set was normalized to have zero mean and unit variance before training. Forward search strategy was applied to find the optimal feature subset, which was obtained when the trained classifier produced the least error rate. Multilayer Perceptron (MLP) is one of the most common ANN topologies, where units are structured in input, hidden, and output layers. The specific structure of MLP was determined by selecting the one leading to the best performance. The selection based on morphology or texture features alone used 1 input layer with 3 nodes, 1 hidden layer with 2 nodes, and 1 output node from 0 to 1 indicating level of malignancy, where 0 means absolute benign and 1 means absolute malignant. Weights and bias of neural network were determined by two-phase training procedure. The first phase had 30 iterations of back propagation, and the second phase had a longer run of conjugated gradient descent to ensure full convergence. The logistic sigmoid function was used to interpret the output variation in terms of probability of class membership within the range (0,1). The performance of the selected classifier was evaluated using ROC analysis.
To explore the best diagnostic performance possibly achievable, the entire dataset was used in training using leave-one-out cross validation. Then, the lesions in the benign and malignant group were randomly split into half, one as training set (14 benign and 22 malignant) and the other as validation set (14 benign and 21 malignant). The selected classifier obtained using the whole dataset with leave-one-out cross validation, and that obtained using the half training set was compared. The area under the ROC achieved in the whole dataset, and that in the half validation set using the classifier selected from half training set was also compared.
RESULTS
Evaluation of computerized vs. manual lesion segmentation
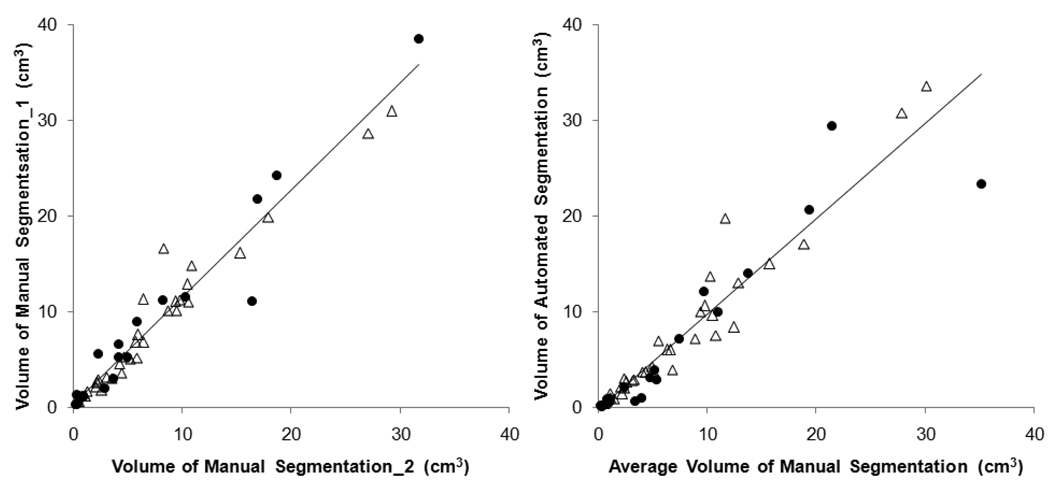
Firstly the consistency between two manual segmentations performed by radiologist was evaluated, shown in Figure 2(a), separately labeled for benign and malignant lesions. The Pearson’s correlation coefficient is r=0.97 for both benign and malignant lesions. Taking the average of the two radiologist's segmentation as the “ground truth,” it was compared to the segmentation obtained by computerized algorithms, shown in Figure 2(b). The correlation coefficient for all lesions is r=0.94; higher for malignant lesions (r=0.97) and lower for benign lesions (r=0.92). When a lesion was considered correctly segmented by the computer when the overlap with the ground truth is ≥ 90%, 64/71 lesions (90%) were correctly segmented by FCM-based method.
Figure 2.
(a) The correlation between two manual lesion segmentation results; triangle for malignant lesion and solid circle for benign lesion. The Pearson’s linear regression line is shown. The overall correlation coefficient is r=0.97, also r=0.97 for both malignant and benign lesions. (b) The correlation between the manual segmentation (average from 2 measurements) and the automated segmentation. The overall correlation coefficient is r=0.94, with higher r=0.97 for malignant lesions and lower r=0.92 for benign lesions.
Diagnostic Performance of Individual and Combined Features
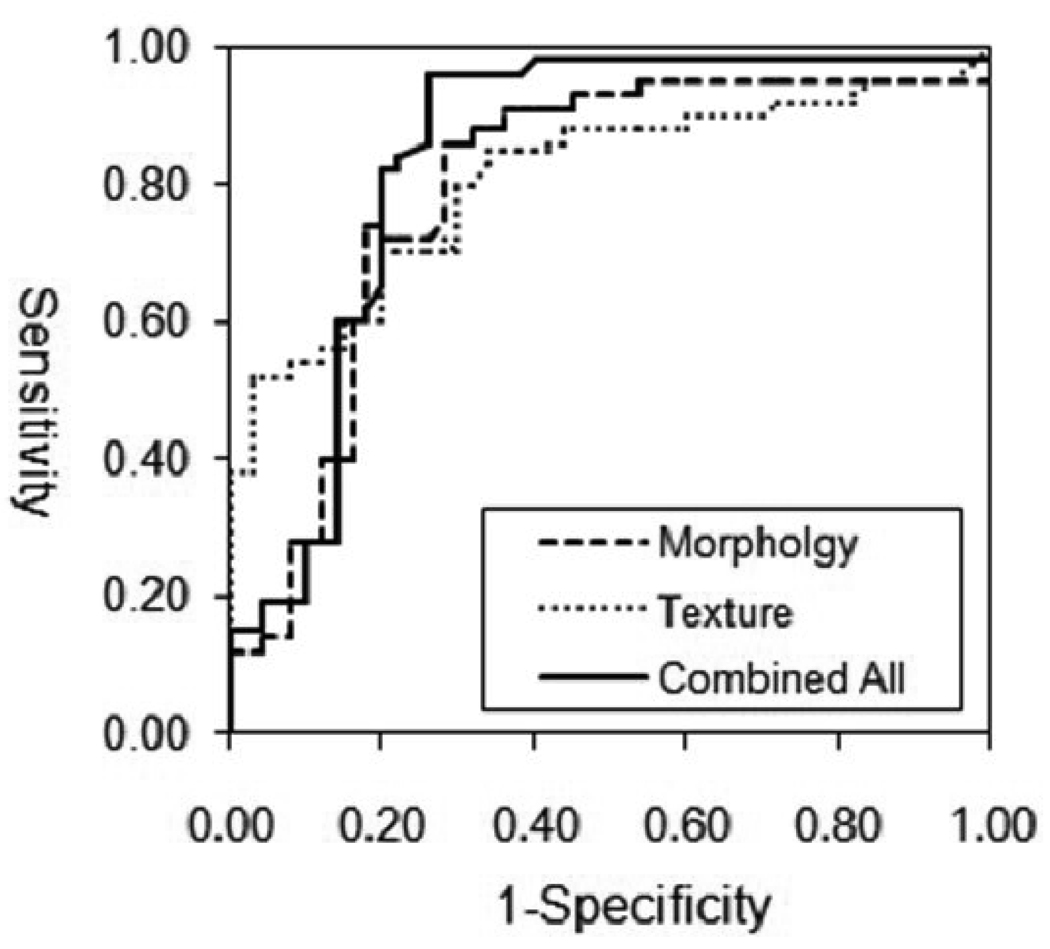
When using eight morphology features alone, the classifier selected by ANN included three parameters: Compactness, Lesion Volume, and NRL Entropy. Using these three features for ROC analysis, it achieved AUC (area under curve) of 0.80. When considering ten texture features alone, the selected parameters were: Gray Level Entropy, Gray Level Sum Average and Homogeneity. The AUC based on these three features was 0.78. When combining the three selected morphology and three texture parameters, the AUC was improved to 0.86. The ROC curves using these 3 sets of data are shown in Figure 3.
Figure 3.
The ROC curves from the ANN analysis. The AUC is 0.80 based on morphology features, and 0.78 based on GLCM texture features, and when combining the morphology and texture features the AUC increases to 0.86.
The analysis was also performed by splitting the dataset into half training and half validation set. Five parameters were selected by ANN in the half training dataset, which achieved the area under ROC of 0.93. They were Compactness, NRL Entropy, Gray Level Entropy, Gray Level Difference Variance, and Homogeneity. All these 5 parameters were among those 6 selected in the entire dataset using leave-one-out cross validation. When these 5 parameters were used for diagnosis in the remaining half validation set, it reached the area under ROC of 0.82, which was close to the 0.86 achieved using the whole dataset with leave-one-out cross validation.
The diagnostic performance of each individual feature selected in this classifier was also analyzed. The mean and standard deviation of these 6 selected parameters in the malignant and benign groups, and diagnostic performance (AUC) based on each individual feature are summarized in Table 2. The morphological feature “Compactness” (p=0.001) and “NRL Entropy” (p=0.01) showed significant differences between the benign and the malignant group. The selected GLCM texture features “Gray Level Entropy” (p=0.002) and “Gray Level Sum Average” (p=0.01) were significantly lower in the benign compared to the malignant group. The other two features, “Homogeneity” (p=0.71) and “Volume” (p=0.27), by themselves did not show significant differences, but they could be combined with other features to achieve the optimal diagnostic accuracy. Figure 4 shows the distribution of 3 selected features, “Compactness”, “Gray Level Entropy”, and “Gray Level Sum Average”, separately in the malignant and benign groups. For each individual parameter, the benign group had a lower value compared to the malignant group, but with a great overlap. Therefore, it is unlikely for a single parameter to have a high diagnostic performance by itself. To investigate the association with lesion phenotype, for each feature the indices from all 71 lesions were sorted in ascending order, so the lesions with high vs. low indices could be identified and compared.
Table 2.
Group Mean, P value, and Diagnostic Accuracy of Selected Parameters
| Parameters | Mean ± SD |
P value | Diagnostic Accuracy (AUC±SD) |
|
|---|---|---|---|---|
| Benign | Malignant | |||
| Compactness | 6.79±3.56 | 26.1±11.3 | 0.001 | 0.76±0.06 |
| NRL Entropy | 0.59±0.33 | 0.31±0.29 | 0.01 | 0.65±0.07 |
| Volume | 8357±4688 | 6335±4975 | 0.27 | 0.57±0.08 |
| Gray Level Entropy | 7.11±1.30 | 8.02±0.88 | 0.002 | 0.74±0.06 |
| Gray Level Sum Average | 25.2±6.58 | 29.2±6.11 | 0.01 | 0.67±0.06 |
| Homogeneity | 0.21±0.12 | 0.22±0.06 | 0.70 | 0.51±0.07 |
Figure 4.
Distribution of three selected features between malignant (M) and benign (B) groups. The benign group had a lower value compared to the malignant group, but with a great overlap. The illustrated cases in Figure 5, Figure 6, and Figure 8 are indicated. The texture feature of 3 malignant cases with high index and 3 benign cases with low index are shown in Figure 7 and Figure 9.
Morphology Feature- Compactness
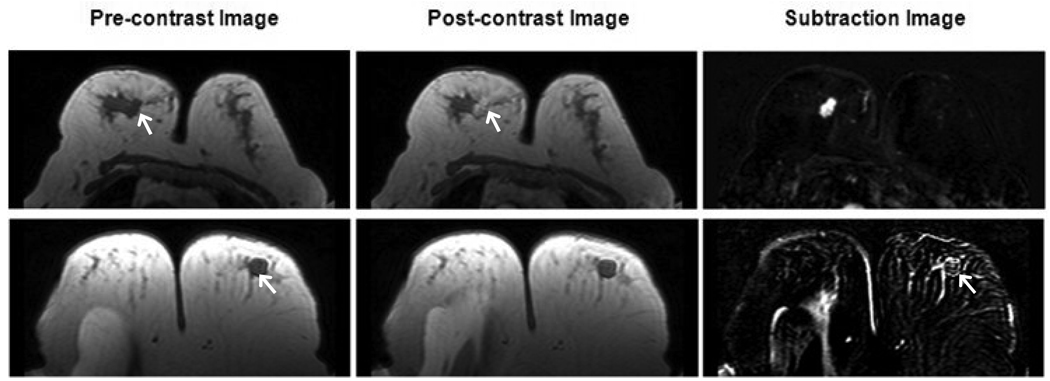
During the entire feature selection testing process, the “Compactness” was consistently selected suggesting its high predictive power. Of all 32 features, the “Compactness” as a single feature could achieve the highest AUC of 0.7. The “Compactness” is defined as the ratio of the surface area to the volume; therefore it is sensitive to shape and margin of the lesion. As shown in Figure 5, the benign lesion has compactness index =1.7 (rank #22/71), and the malignant lesion has compactness index =63 (rank #60/71). This feature appeared to be associated with shape and margin in BI-RADS lexicon; round shape and smooth margin for the benign; and irregular shape and irregular or spiculated margin for the malignant lesion.
Figure 5.
The Compactness index is sensitive to the spherical vs. non-spherical shapes. Pre-contrast, post-contrast and subtraction images from two cases with relative low/high Compactness index are shown. The top row is one malignant lesion with compactness index 63, ranked #60 in all 71 lesions. The bottom row is one benign case with compactness index 1.7, ranked #22 in all 71 lesions.
Texture Feature- GLCM Gray Level Entropy
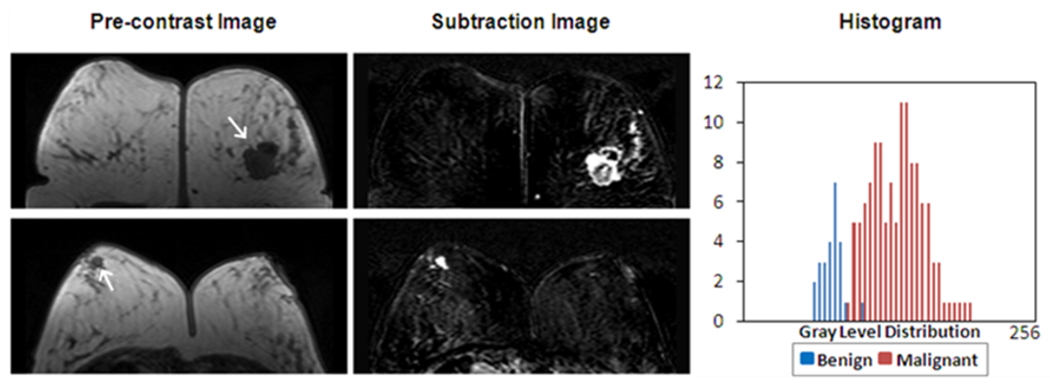
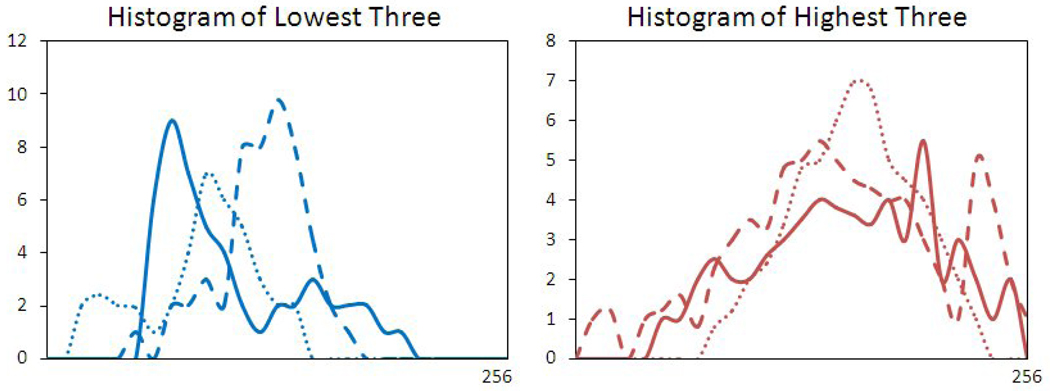
The GLCM texture feature “Gray Level Entropy” was significantly higher (p=0.002) in the malignant group than the benign group. As shown in Figure 6, a homogeneously enhanced lesion has a lower GLCM “Gray Level Entropy” (benign lesion, Entropy index=6.6, rank #10/71) compared to the heterogeneously enhanced lesion (malignant lesion, Entropy index =8.1, ranked #41/71). The gray level intensity histogram calculated from the displayed image is also shown in Figure 6. The broader width of the malignant peak represents a relatively heterogeneous gray level distribution. After sorting the “Gray Level Entropy” indices using ascending order, the top 3 malignant lesions with highest indices and the bottom 3 benign lesions with the lowest indices with matched lesion sizes were identified. The combined histogram is shown in Figure 7. The histogram of 3 benign lesions with low “Gray Level Entropy” indices showed a narrower peak and lower intensity compared to 3 malignant cases with high indices. Therefore, the GLCM entropy appeared to be associated with the internal enhancement patterns (homogeneous vs. heterogeneous), as well as the enhancement intensity defined in the BI-RADS lexicon.
Figure 6.
The “Gray Level Entropy” index is sensitive to homogeneous vs. non-homogeneous patterns. Pre-contrast, subtraction images and the gray level histogram from two cases with relative low/high “Gray Level Entropy” index are shown. The top row is one malignant case with “Gray Level Entropy” index 8.1, ranked #41 in all 71 lesions. The bottom row is one benign case with “Gray Level Entropy” index 5.6, ranked #10 in all 71 lesions. The malignant case has a broader peak of gray level distribution and a higher intensity compared to the benign case.
Figure 7.
The “Gray Level Entropy” index from 3 malignant lesions with the highest index, and 3 benign lesions with the lowest index. The sizes were 1.5–2.0 cm, matched between the malignant and benign lesions. The malignant lesions had broader distribution peaks compared to the benign ones.
Texture Feature- GLCM Gray Level Sum Average
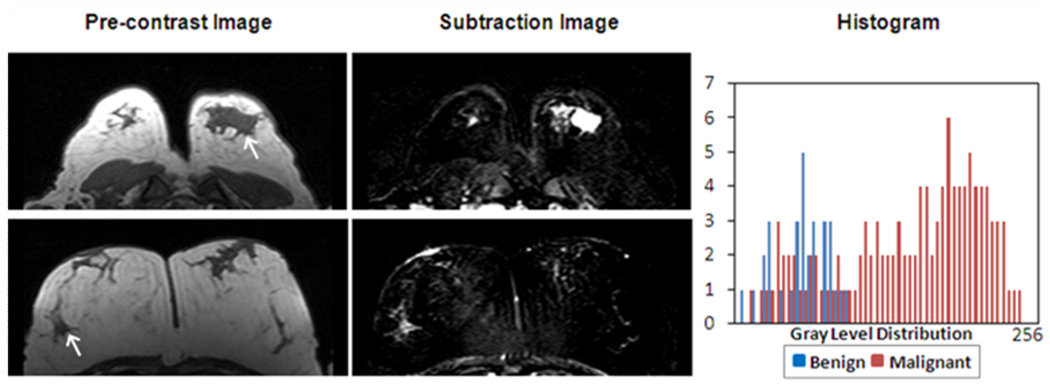
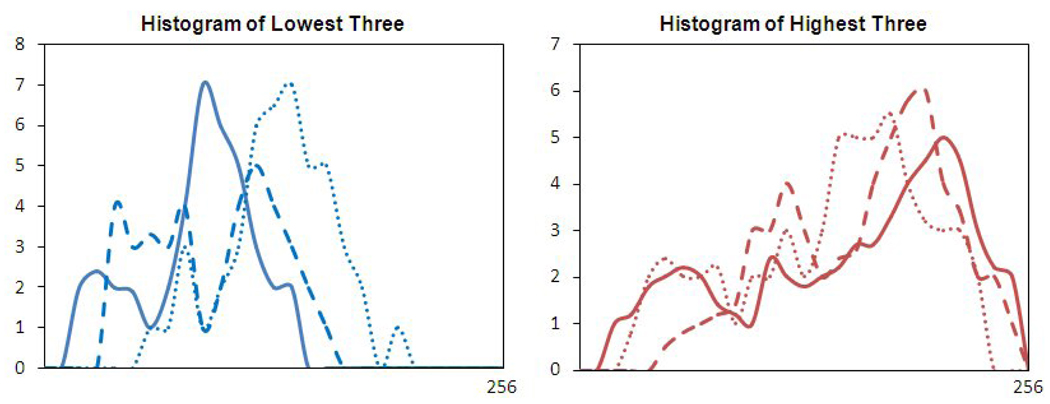
Another gray level texture feature ‘Gray Level Sum Average’ was also significantly higher (p=0.01) in the malignant group than in the benign group. As shown in Figure 8, a strongly enhanced malignant lesion has a higher GLCM “Gray Level Sum Average” (sum average index =37, ranked #66/71) compared to the benign lesion (sum average index =22, ranked #22/71). Figure 9 shows the histogram of 3 malignant lesions with the highest indices and 3 benign size-matched lesions with the lowest indices. The peak of the benign lesion histogram appeared at the lower end of the spectrum compared to that of malignant lesions, also their peak widths were narrower compared to those of malignant lesions. This feature appeared to be associated with the gray level enhancement intensity and homogeneity. Therefore, similar to GLCM entropy, the GLCM sum average appeared to be associated with the enhancement intensity and the internal enhancement patterns (homogeneous vs. heterogeneous) defined in the BI-RADS lexicon. Despite the similarity shown in these examples with very high and very low indices, the GLCM entropy and sum average was not correlated with each other (r=0.4), and were selected as independent features.
Figure 8.
The “Gray Level Sum Average” is also sensitive to the enhancement distributions. Pre-contrast, subtraction images and the gray level histogram from two cases with relative low/high “Gray Level Sum Average” index are shown. The top row is one malignant case with “Gray Level Sum Average” index 37, ranked #66 in all 71 lesions. The bottom row is one benign case with “Gray Level Sum Average” index 22, ranked #21. The malignant case has a higher intensity also a broader peak of distribution compared to the benign case.
Figure 9.
The “Gray Level Sum Average” index from 3 malignant lesions with the highest index, and 3 benign lesions with the lowest index. The sizes were 1.2–1.8cm, matched between the malignant and benign lesions. The peaks of 3 malignant lesions occurred at higher end of the intensity spectrum compared to the benign ones, also the distribution was broader.
DISCUSSION
Compared to the well-established CAD for mammogram, development of automated CAD for breast MRI is in its early stage. Only a few investigations have pursued automated lesion segmentation and/or feature extraction for lesions detected by breast MRI, as summarized in Table 3. In this study we applied quantitative analysis to characterize the morphology and texture features of breast lesions and used the artificial neural network to select a classifier for differential diagnosis. This comprehensive approach was only reported by Meinel et al., but only using a small set of features [21]. They extracted a set of 6 shape-based and 1 intensity-based features using back propagation neural networks, and showed that when this information was provided to radiologists, their performance was improved [21]. In our study a total of 8 morphology and 10 GCLM texture features were extracted to characterize each lesion. Six features, 3 morphology and 3 texture, were selected by ANN using leave-one-out cross validation, and they could achieve an area under the ROC curve of 0.86. When splitting the dataset, 5 features were selected in the half training set, and they could achieve the area under the ROC curve of 0.82 in the remaining half validation set. The consistency of selected parameters using these two models demonstrated robustness of this approach. However, the ultimate performance of the selected classifier will need to be tested in a different independent dataset.
Table 3.
Previous Publications on Semi/Automated Lesion Classification in Breast MRI
| Ref # | Author (year) | Case # | Lesion Segmentation |
Feature | Statistical Analysis |
|---|---|---|---|---|---|
| 15 | Gihuijs (1998) | 15 M, 13 B | Manual | 3D shape-based | LDA |
| 16 | Gibbs (2003) | 20 M, 23 B | Manual | GLCM Texture, DCE | LDA |
| 18 | Chen (2004) | 77 M, 44 B | Region growing | DCE | T-test |
| 19 | Chen (2005) | 77 M, 44 B | FCM | N/A | N/A |
| 20 | Chen (2006) | 77 M, 44 B | FCM | Hot Spot DCE | T-test |
| 17 | Liney (2006) | 32 M, 15 B | Threshold | Shape-based, DCE | T-test |
| 21 | Meinel (2007) | 40 M, 23 B | Region growing | Shape-based, DCE | BNN |
| 30 | Chen (2007) | 77 M, 44 B | FCM | 3D texture | T-test |
M: malignant lesions; B: benign lesions; FCM: fuzzy c-means; GLCM: gray level co-occurrence matrices. DCE: Dynamic Contrast-Enhanced parameters, LDA: Linear Discriminative Analysis, BNN: Backpropagation Neural Network
In this study a semi-automated lesion segmentation method with minimum operator intervention was implemented and evaluated. The method required the operator to indicate the beginning and ending slices containing the lesion, and to place an initial square-shaped ROI on one imaging slice. The purpose was to indicate the lesion location. It should be noted that the pre-marked ROI does not need to be the smallest rectangular box covering the lesion, which is required in the algorithm reported by Penn et al. [25].
In order to determine the accuracy of the FCM-defined lesion ROI, we use radiologist’s manual drawing as the reference. The radiologist performed the segmentation twice, and the results showed a correlation coefficient (r=0.97), indicating a high consistency. When the averaged manual segmentation ROI was used to correlate with the FCM-segmentation results, the correlation coefficient was r=0.97 in malignant lesions, similar as that between two manual segmentations; but the correlation in benign lesions was lower (r=0.92). Five of the 7 cases showing < 90% overlap were benign lesions. They either had lower enhancement or with ill-defined margin, that made determination of boundary more difficult. Another reason that may lead to blurred lesion boundary is the motion artifact between pre- and post-contrast images. The currently available registration method aligns the entire image; and the registration of breast may be compromised to accommodate registration of other body parts such as the thoracic region. Therefore, in this study we did not apply registration. Further development of a better registration method focusing on registration of the breast may improve the accuracy of the lesion segmentation.
A primary advantage of using the neural network to search of diagnostic classifier is that it does not require user input to choose an appropriate model or to select features. Szabo et al. applied a similar approach to evaluate the discriminative ability of combined qualitative morphologic and kinetic features of breast lesions [26]. The features were visually assessed by three experienced radiologists based on manually drawn ROIs. The dataset was randomly divided into a training set of 59 lesions (46 malignant and 13 benign) and a verification set of 46 lesions (29 malignant and 17 benign). Other than ANN the conventional methods such as logistic regression method can also be used to build linear predictive models. The performance between different classifiers selected by different methods may be compared in the future.
Very little attention was focused on linking computer-extracted lesion features to BI-RADS lexicon. Therefore, the second aim of this study is to explore the association of the extracted quantitative features with the lesion phenotype appearance on MRI. Examples from a particular imaging slice of lesions with high vs. low index were first investigated. Then 3 size-matched lesions, with the highest and lowest indices were compared. Size-matching was necessary to ensure elimination of this possible confounder.
The “Compactness” was correlated with “Sphericity” and “Roughness”. The benign lesions have lower “Compactness” and “Roughness” indices, but higher “Sphericity” compared to malignant lesions. The result is consistent with Liney et al. reporting that benign lesions were found to extend more along spherical patterns than malignant lesions [17]. By definition, the “Compactness” is expected to be associated with shape and margin in BI-RADS lexicon, and the example given in Figure 5 supports this link. “NRL Entropy” describes the complexity of the radius from lesion boundary to the center of mass, so it is expected to be associated with the margin of a lesion.
Most of the GLCM texture features were highly correlated with each other. A homogenously enhanced lesion has lower “Gray Level Entropy” and higher “Gray Level Energy” compared to a heterogeneously enhanced lesion. The examples given in Figure 6 indicate that the benign lesions were more likely to show more homogeneous and lower enhancements. A similar finding was reported by Gibbs and Turnbull [16]. They compared four breast classification schemes that utilize enhancement and texture features based on manually-drawn ROI in 45 malignant and 34 benign lesions. When texture parameters were combined in their logistic regression model, the “Gray Level Entropy” and “Homogeneity” were also found to be the most important feature for lesion differentiation. The increase in entropy in malignant lesions may suggest that malignant lesions are more complex than benign lesions.
The quantitative analysis to extract the morphology and texture features using computer-based algorithm is essential for the development of CAD. While the enhancement pattern and shape characteristics can be easily evaluated by visual assessment, it represents a great challenge to link such features to computational numbers, particularly the texture features. Each quantitative feature many be associated with different descriptors defined in BI-RADS lexicon to some extent. For example, shape and margin can both contribute to the “Compactness” index. The other two features presented in this study, “Gray Level Entropy” (Figure 6 and Figure 7) and “Gray Level Sum Average” (Figure 8 and Figure 9), both are associated with homogeneous/heterogeneous enhancements and the degree of enhancements; which can not be separated. This is a complex problem, and there will not be a simple one-to-one correspondence relationship. The study presented here may provide the initial step towards establishing this link between computer-based quantitative features and BI-RADS visual descriptors.
Despite our encouraging results, some limitations exist in the present study. First, spiculation is known to be a characteristic feature of malignant lesion, but that can only be evaluated on high spatial resolution images. An active contour model to delineate the tumors after the initial estimation on FCM-based segmentation may be applied to enhance delineation of spiculation. Other analysis methods, such as radial length analysis [27] and Fourier analysis [28,29], may also be applied to better evaluate the extent of spiculation. Second, the automatically extracted features in our study were investigated slice by slice and the averaged value was used to represent the whole lesion. Gihuijs et al. reported an alternative method [15]. They computationally reconstructed the whole 3D lesion, then performed analysis in all three dimensions. Chen et al. started with automated lesion segmentation on 2D slices then after reformatting to an isotropic voxel size they performed 3D texture analysis [30]. The success of a true 3D texture analysis relies on isotropic image acquisition in breast MRI, which requires a longer imaging time or smaller coverage. It may not be a worthy trade-off to get the texture information along the slice thickness dimension. Third, the feature of the lesion shown on pre-contrast images was not analyzed. For a solitary lesion imbedded in fat, pre-contrast images may allow a better visualization of the lesion shape and margin. Especially when the lesion is not strongly enhanced (such as the benign case shown in Figure 5), the pre-contrast images may provide a superior contrast quality than that of the subtraction image for evaluation of lesion shape and margin for diagnosis. Therefore, indeed the pre-contrast images may provide additional information to further improve the diagnostic performance or the confidence of the radiologists; however, by itself it is not sufficient for making diagnosis. Forth, we only included mass-type breast lesions to demonstrate feasibility of our approach. The difficulty to characterize a non-mass lesion lies on the uncertainty in lesion segmentation, because the boundary is not as well-defined as in the mass lesion. Since all features are derived from the tissue within the segmented lesion ROI, the diagnostic performance will be heavily dependent on the accuracy of lesion segmentation. Therefore at this early developmental stage the non-mass lesions were excluded in this study. In the future other lesions displaying non-mass like enhancement patterns, such as linear, linear-branching, segmental, regional, should be included to test the performance of obtained classifier. Lastly, we did not include kinetic features. Gibbs et al. [16] reported that the diagnostic accuracy increased from 80% accuracy when only relying on texture features, to 92% with combined texture and kinetic parameters. Liu et al. [31] also reported that addition of kinetic criteria might improve the overall diagnosis accuracy. Since our focus was to establish the link between quantitative morphology and texture features with BI-RADS descriptor, the kinetic features were intentionally left out in this work, but those will be added into analysis in the future.
In summary, we have developed quantitative morphological and texture features analysis method for breast MRI diagnostic prediction. The ROC analysis result showed a reasonably high accuracy. In this work we only analyzed unspecific morphological and texture features, aiming to demonstrate the feasibility of this approach to serve as the basic frame for further development into an automated true CAD, i.e. that provides diagnostic impression. Other features, such as spiculation, rim-enhancement and kinetic features with fast wash-in and wash-out, are the most specific features suggesting malignancy. They may be directly incorporated into the final diagnostic classifier. The availability of a breast MRI CAD system may improve the confidence in interpretation of breast MRI, especially for mammographers with limited MRI experience.
Acknowledgement
This work was supported in part by NIH/NCI R01 CA90437, CA121568 and the California Breast Cancer Research Program # 9WB-0020.
APPENDIX
The 8 morphology features described in the text are calculated as follows: (p is the pixel size on the imaging plane, and t is the slice thickness, r is the individual radial length,).
| Volume |
|
(1) | |
| Surface |
|
(2) | |
| Compactness |
|
(3) | |
| NRL mean |
|
(4) | |
| Sphericity |
|
(5) | |
| NRL entropy |
|
(6) | |
| Where |
|
||
| NRL ratio |
|
(7) | |
| Roughness |
|
(8) |
Where FROI is the pixel number in the ROI,
SROI is the pixel number along the boundary of the ROI,
σNRL is the standard deviation of NRL,
Footnotes
This work was conducted at Tu and Yuen Center for Functional Onco-Imaging at University of California, Irvine
This work was presented at the 2007 Joint ISMRM-ESMRMB meeting held in Berlin, Germany.
REFERENCES
- 1.Fischer U, Kopka L, Grabbe E. Breast carcinoma: effect of preoperative contrast-enhanced MR imaging on the therapeutic approach. Radiology. 1999;213:881–888. doi: 10.1148/radiology.213.3.r99dc01881. [DOI] [PubMed] [Google Scholar]
- 2.Schelfout K, Van GM, Kersschot E, et al. Contrast-enhanced MR imaging of breast lesions and effect on treatment. Eur.J Surg.Oncol. 2004;30:501–507. doi: 10.1016/j.ejso.2004.02.003. [DOI] [PubMed] [Google Scholar]
- 3.Mumtaz H H, Hall-Craggs MA, Davidson T, et al. Staging of symptomatic primary breast cancer with MR imaging. Am. J. Roentgenol. 1997;169:417–424. doi: 10.2214/ajr.169.2.9242745. [DOI] [PubMed] [Google Scholar]
- 4.Esserman L, Hyton N, Yassa L, et al. Utility of magnetic resonance imaging in the management of breast cancer: evidence for improved preoperative staging. J. Clin. Oncol. 1999;17:110–119. doi: 10.1200/JCO.1999.17.1.110. [DOI] [PubMed] [Google Scholar]
- 5.ZhangY Y, Fukatsu H, Naganawa S, et al. The role of contrast-enhanced MR mammography for determining candidates for breast conservation surgery. Breast Cancer. 2002;9:231–239. doi: 10.1007/BF02967595. [DOI] [PubMed] [Google Scholar]
- 6.Rieber A, Schirrmeister H, Gabelmann A, et al. Pre-operative staging of invasive breast cancer with MR mammography and/or PET: boon or bunk? Br. J. Radiol. 2002;75:789–798. doi: 10.1259/bjr.75.898.750789. [DOI] [PubMed] [Google Scholar]
- 7.Li H, Wang Y, Liu KJ, et al. Computerized radiographic mass detection--part I. Lesion site selection by morphological enhancement and contextual segmentation. IEEE Transactions on Medical Imaging. 2001;20:289–301. doi: 10.1109/42.921478. [DOI] [PubMed] [Google Scholar]
- 8.Polakowski WE, Cournoyer DA, Rogers SK. Computer-aided breast cancer detection and diagnosis of masses using difference of Gaussians and derivative-based feature saliency. IEEE Trans. Med. Imaging. 1997;16:811–819. doi: 10.1109/42.650877. [DOI] [PubMed] [Google Scholar]
- 9.Rangayyan RM, EL-Faramawy NM, Desautels JE. Measures of acutance and shape for classification of breast tumors. IEEE Trans Med Imaging. 1997;16(6):799–810. doi: 10.1109/42.650876. [DOI] [PubMed] [Google Scholar]
- 10.Chan HP, Sahiner B, Petrick N, et al. Computerized classification of malignant and benign microcalcifications on mammograms: texture analysis using an artificial neural network. Phys Med Biol. 1997 Mar;42(3):549–567. doi: 10.1088/0031-9155/42/3/008. [DOI] [PubMed] [Google Scholar]
- 11.Drukker K K, Giger ML ML, Vyborny CJ, et al. Computerized detection and classification of cancer on breast ultrasound. Acad Radiol. 2004 Nov;:526–535. doi: 10.1016/S1076-6332(03)00723-2. [DOI] [PubMed] [Google Scholar]
- 12.Huang YL, Chen DR. Support vector machines in sonography: application to decision making in the diagnosis of breast cancer. Clin Imaging. 2005 May–Jun;29(3):179–184. doi: 10.1016/j.clinimag.2004.08.002. [DOI] [PubMed] [Google Scholar]
- 13.Kim KG, Cho SW, Min SJ. Computerized scheme for assessing ultrasonographic features of breast masses. Acad Radiol. 2005 Jan;12(1):58–66. doi: 10.1016/j.acra.2004.11.010. [DOI] [PubMed] [Google Scholar]
- 14.Breast Imaging Reporting and Data System (BI-RADS) Breast Imaging Atlas. American College of Radiology. 2003 [Google Scholar]
- 15.Gilhuijs KG, Giger ML, Bick U. Computerized analysis of breast lesions in three dimensions using dynamic magnetic-resonance imaging. Med Phys. 1998;9:1647–1654. doi: 10.1118/1.598345. [DOI] [PubMed] [Google Scholar]
- 16.Gibbs P P, Turnbull LW. Textural analysis of contrast-enhanced MR images of the breast. Magn Reson Med. 2003 Jul;50(1):92–98. doi: 10.1002/mrm.10496. [DOI] [PubMed] [Google Scholar]
- 17.Liney GP, Sreenvias M, Garcia-Alvarez R, et al. Breast lesion analysis of shape technique: semi-automated vs. manual morphological description. J Magn Reson Imaging. 2006 Apr;23(4):493–498. doi: 10.1002/jmri.20541. [DOI] [PubMed] [Google Scholar]
- 18.Chen W, Giger ML, Lan L, et al. Computerized interpretation of breast MRI: investigation of enhancement-variance dynamics. Med Phys. 2004 May;31(5):1076–1082. doi: 10.1118/1.1695652. [DOI] [PubMed] [Google Scholar]
- 19.Chen W W, Giger ML, Bick U. A fuzzy c-means (FCM)-based approach for computerized segmentation of breast lesions in dynamic contrast-enhanced MR images. Acad Radiol. 2006 Jan;13(1):63–72. doi: 10.1016/j.acra.2005.08.035. [DOI] [PubMed] [Google Scholar]
- 20.Chen W, Giger ML, Bick U, et al. Automatic identification and classification of characteristic kinetic curves of breast lesions on DCE-MRI. Med Phys. 2006 Aug;33(8):2878–2887. doi: 10.1118/1.2210568. [DOI] [PubMed] [Google Scholar]
- 21.Meinel LA, Stolpen AH, Berbaum KS, et al. Breast MRI lesion classification: improved performance of human readers with a backpropagation neural network computer-aided diagnosis (CAD) system. J Magn Reson Imaging. 2007 Jan;25(1):89–95. doi: 10.1002/jmri.20794. [DOI] [PubMed] [Google Scholar]
- 22.Behrens S, Laue H H, Althaus M, et al. Computer assistance for MR based diagnosis of breast cancer: Present and future challenges. Comput Med Imaging Graph. 2007 Jun–July;31(4–5):236–247. doi: 10.1016/j.compmedimag.2007.02.007. [DOI] [PubMed] [Google Scholar]
- 23.Haralick RM, Shanmugam K, Dinstein I. Texture parameters for image classification. IEEE Trans SMC. 1973;3:610–621. [Google Scholar]
- 24.Laws KI. Rapid texture identification. Proc SPIE Missile Guidance. 1980;238:376–380. [Google Scholar]
- 25.Penn AL, Thompson SF, Schnall MD, et al. Fractal discrimination of MRI breast masses using multiple segmentations. Proc SPIE Med Imaging 2000: Image processing. 2000;3979:959–966. [Google Scholar]
- 26.Szabo BK, Aspelin P, Wiberg MK. Neural network approach to the segmentation and classification of dynamic magnetic resonance images of the breast: comparison with empiric and quantitative kinetic parameters. Acad Radiol. 2004 Dec;11(12):1344–1354. doi: 10.1016/j.acra.2004.09.006. [DOI] [PubMed] [Google Scholar]
- 27.Chou YH, Tiu CM, Hung GS, et al. Stepwise logistic regression analysis of tumor contour features for breast ultrasound diagnosis. Ultrasound Med Biol. 2001 Nov;27(11):1493–1498. doi: 10.1016/s0301-5629(01)00466-5. [DOI] [PubMed] [Google Scholar]
- 28.Sahiner B, Chan HP, Petrick N, et al. Improvement of mammographic mass characterization using spiculation measures and morphological features. Med Phys. 2001 Jul;28(7):1455–1465. doi: 10.1118/1.1381548. [DOI] [PubMed] [Google Scholar]
- 29.Stavros AT, Thickman D, Rapp CL, et al. Solid breast nodules: Use of sonography to distinguish between benign and malignant lesions. Radiology. 1995;196:123–134. doi: 10.1148/radiology.196.1.7784555. [DOI] [PubMed] [Google Scholar]
- 30.Chen W, Giger ML, Li H. Volumetric texture analysis of breast lesions on contrast-enhanced magnetic resonance images. Magn Reson Med. 2007 Sep;58(3):562–571. doi: 10.1002/mrm.21347. [DOI] [PubMed] [Google Scholar]
- 31.Liu PF, Detain JF, Caduff RF RF, et al. Improved diagnostic accuracy in dynamic contrast enhanced MRI of the breast by combined quantitative and qualitative analysis. Br J Radiol. 1998 May;71(845):501–509. doi: 10.1259/bjr.71.845.9691895. [DOI] [PubMed] [Google Scholar]


