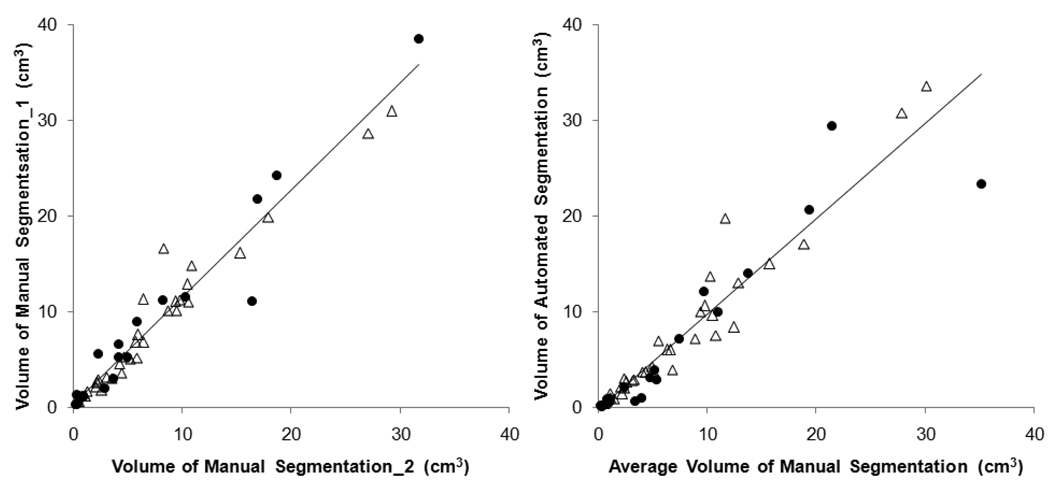
Figure 2.
(a) The correlation between two manual lesion segmentation results; triangle for malignant lesion and solid circle for benign lesion. The Pearson’s linear regression line is shown. The overall correlation coefficient is r=0.97, also r=0.97 for both malignant and benign lesions. (b) The correlation between the manual segmentation (average from 2 measurements) and the automated segmentation. The overall correlation coefficient is r=0.94, with higher r=0.97 for malignant lesions and lower r=0.92 for benign lesions.

