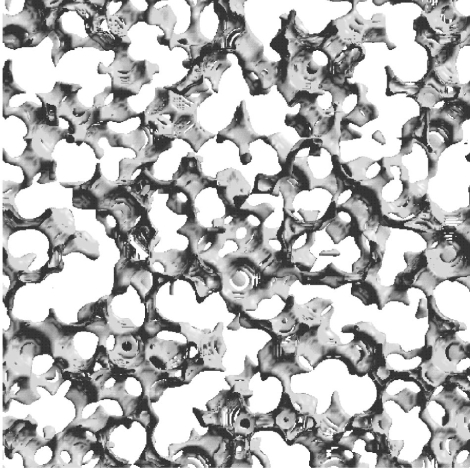
Figure 15.
Ag+ conduction paths in α-AgI modeled at 525 K using the reverse Monte Carlo method. In contrast to Figure 11 which shows the conduction paths in the time and space averaged structure that conforms to the space group symmetry, this figure shows the localized paths at a specific hypothetical point and at a particular time with the atoms displaced from their average positions by thermal motion. Reproduced with permission from ref (135). Copyright 2000 by the American Physical Society.

