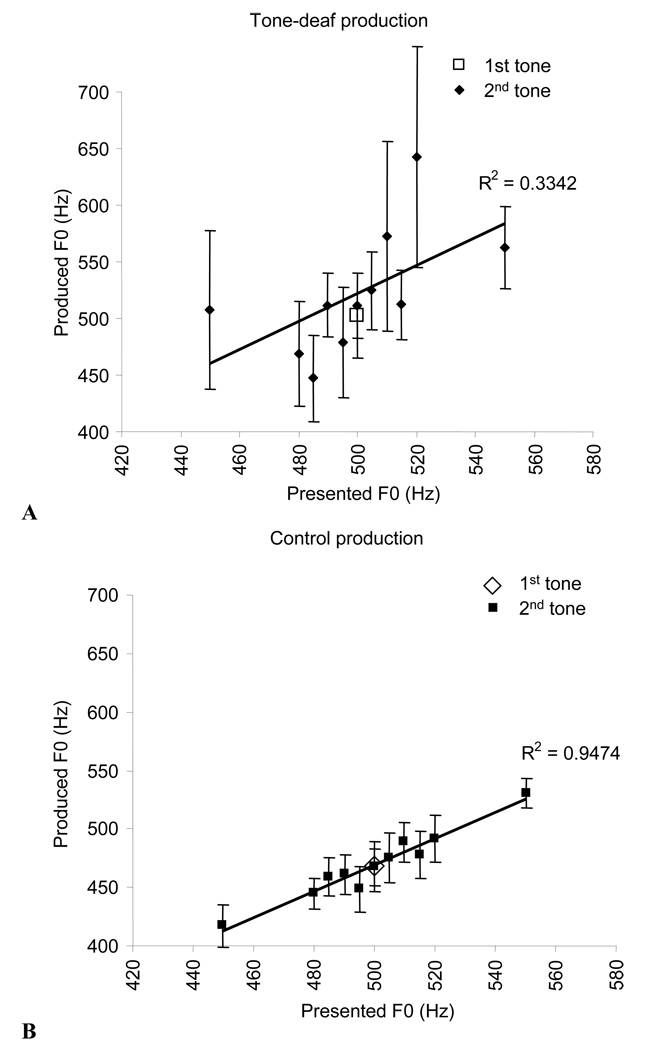
Figure 2.
A. Mean fundamental frequencies of the two produced tones in tone-deaf listeners. The first tone had a target frequency at a constant 500Hz, whereas the second tone ranged from 450–550Hz. B. Same as A in normal controls. While both groups show a significant positive correlation between target and produced fundamental frequency, the correlation is significantly lower in the tone-deaf group (t(1,10) = 2.3, p = 0.046) and variability in pitch production is higher for the tone-deaf group, as indicated by a t-test comparing standard error across different subjects producing the same pitch: t(1,20) = 3.6, p = 0.0015. Error bars indicate between-subject standard error.

