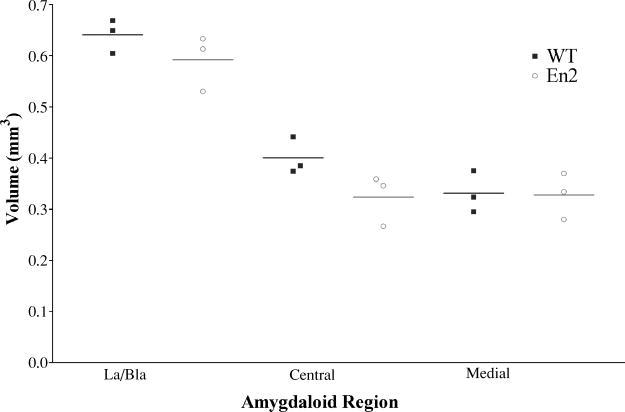
Figure 2. Volumetric analysis of amygdaloid regions in En2−/− and control animals.
Volumes were calculated for the three subdivisions shown (La/Bla, Central and Medial) on the left side of 3 month old male mice. Solid squares and open circles represent actual volume measurements (as reported in Table 1) for the three wild type and three En2−/− mice examined. Horizontal lines indicate the average of the three volume measurements in each amygdalar nucleus of each genotype. Statistical analysis indicates no significant difference in the amygdalar volumes of the lateral/basolateral, central, and medial nuclei of En2−/− and wild type animals.

