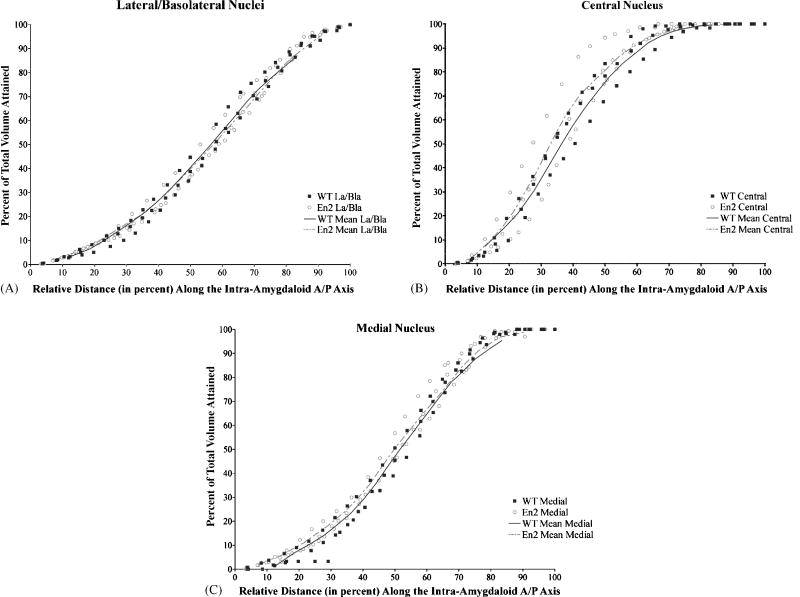
Figure 3. Distribution of intra-amygdaloid volume in En2−/− and controls along the A/P axis.
Area measurements were taken (using Image J software) of the amygdalar subdivisions on each slide of about 25 representative slides bearing coronal histological sections from 3 mutant and 3 control animals. The percentage of the total amygdalar volume attained is plotted as a function of the distance from the anterior most section of each nucleus. Solid squares represent measurements converted to a percentage of total volume at a given distance from control animals, while open circles represent the corresponding measurements from En2−/− animals (see methods section for a detailed description of conversion calculations). Each line (dashed in the case of the En2−/− group of three animals studied) connects the mean value points of all three animals within each genotype. For example, compare the mean value lines at ½ the way through the lateral/basolateral nuclei (or at a 50% distance from the anterior most section). Here about 35% of the volume of this subdivision is accounted for in both mutants and controls. In each of the nuclei examined, the distribution of the En2−/− volume tracks closely to controls, indicating a normal distribution of volume and shape of the En2−/− amygdala when compared to controls.

