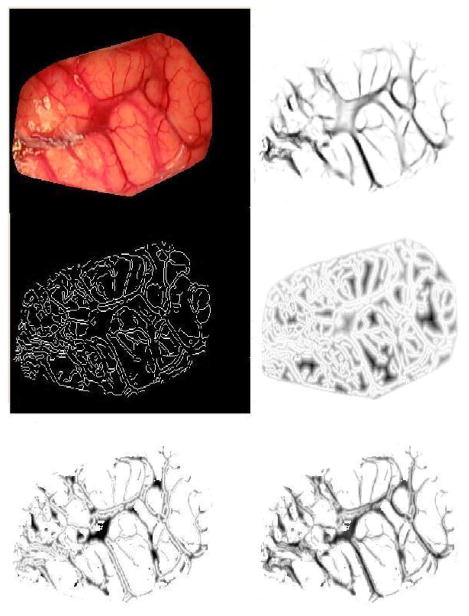
Fig. 3.

Illustration of the cost matrix used to find vessels. The top left panel shows the original image of patient #7 reported in the study. The top right panel shows the vesselness image. The middle left panel is the edge map. The middle right panel shows the distance map computed from the edge map. The bottom left panel shows the distance map masked by a vessel mask obtained by thresholding the vesselness image using a threshold equal to 0.96. The bottom right panel shows the final cost matrix.
