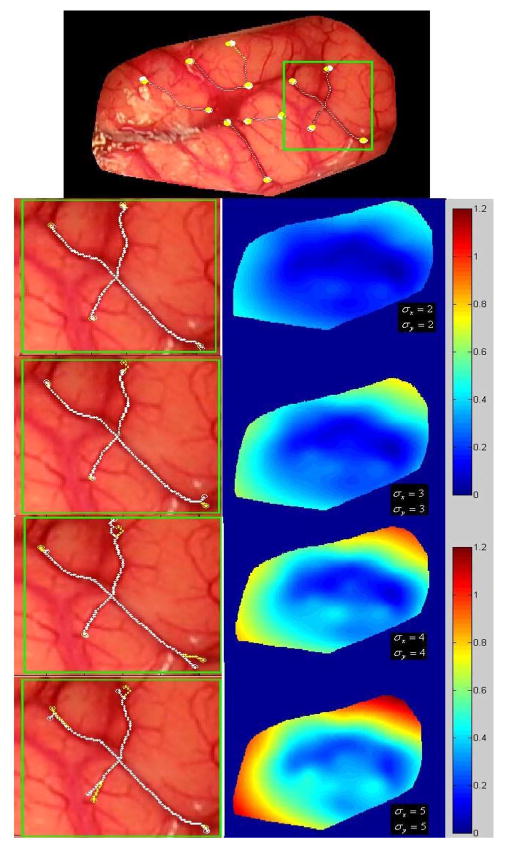
Fig. 7.

Effect of starting and ending points displacement on the registration. Top panel: original image of patient #7. The other panels show the region within the green square magnified (on the left) and the difference maps on the right. From top to bottom, the standard deviation used to perturb the points was increased from 2 to 5 pixels.
