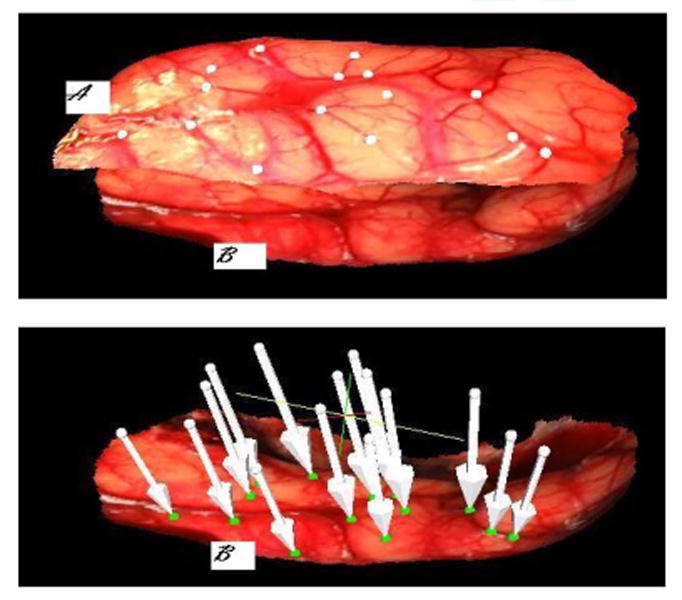
Fig. 8.

Top panel. (A) Texture surface obtained before resection. (B) Texture surface obtained after resection of patient #7. The white points on the preresection scan and the green points in the postresection scan were selected manually as corresponding points. On the bottom panel, the white arrows show where each white point has been mapped onto the postresection scan.
