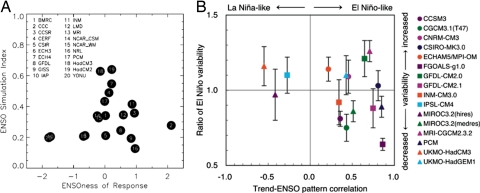
Fig. 5.
Climate model projections of future changes in ENSO and the Tropical Pacific mean state. (A) Scatter plot of the mean response versus the quality of a model to simulate ENSO [from Collins (27)]. The models that simulate neither an El Niño-like nor a La Niña-like response perform best with respect to ENSO. Thus, if the models are weighted by their skill in simulating ENSO, the best estimate would be for a zonally symmetric change in the mean state. (B) Scatter plot showing the “ENSOness” of the mean response versus the change in the ENSO activity. [Reproduced with permission from ref. 25 (Figure 10.16; Copyright 2007, Cambridge University Press).]

