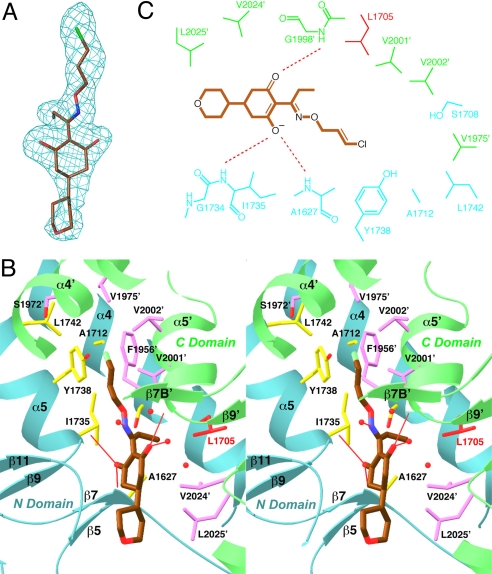
Fig. 2.
The binding mode of tepraloxydim. (A) Final omit Fo–Fc electron density at 2.3-Å resolution for tepraloxydim, contoured at 3σ. (B) Stereographic drawing showing the binding site for tepraloxydim. The N domain of one monomer is colored in cyan, and the C domain of the other monomer in green. The side chains of residues in the binding site are shown in yellow and magenta, respectively. The side chain of Leu-1705 is shown in red. Hydrogen bonds from the inhibitor to the protein or waters are indicated with thin red lines. Several other water molecules in the binding site are also shown as red spheres. (C) Schematic drawing of the interactions between tepraloxydim and the CT domain.

