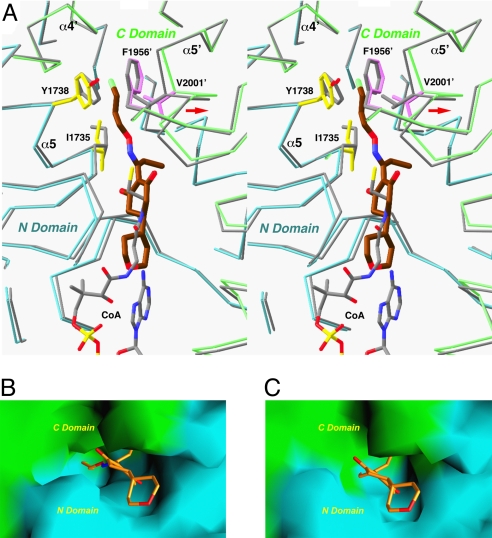
Fig. 3.
Conformational changes in the CT domain upon inhibitor binding. (A) Structural overlay of the CT domain free enzyme (in gray) and the tepraloxydim complex (in cyan and green for the N and C domains) near the inhibitor binding site. Side chains in the binding site with large conformational changes are also shown. Phe-1956′ is shown for reference. The position of CoA is also shown (in gray). The shift in the position of the α5′ helix is indicated with the red arrow. (B) Molecular surface of the binding site in the tepraloxydim complex, colored in cyan for the N domain and green for the C domain. (C) Molecular surface of the active site of the free enzyme. The model of tepraloxydim is included for reference, and the O-substituent of the oxime moiety is in steric clash with the enzyme. For panels B and C, residues 1759–1772 and 2026′–2098′ have been removed to give a better view of the binding site.

