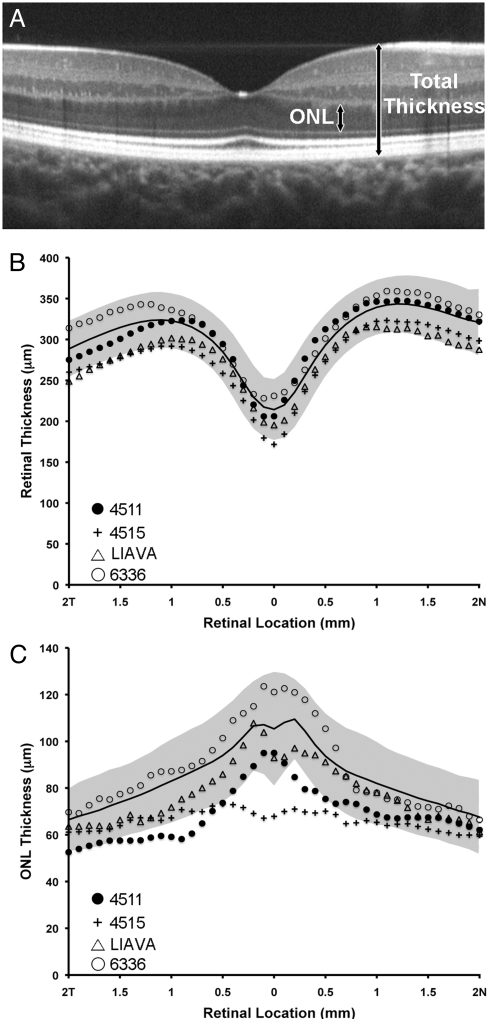
Fig. 3.
Assessing retinal lamination. (A) SD-OCT registered sum from the right eye of a 19-year-old female with normal color vision. Arrows illustrate the boundaries used for the ONL and total thickness measurements. Total retinal thickness (B) and ONL thickness (C) as a function of distance (n = nasal, T = temporal) from the center of the foveal pit (0 mm on abscissa) for the C203R subjects (4511 and 4515), the LIAVA subject (ref. 24), and a single protan control (6336). Average normal thickness values are plotted as black line with shaded area representing ± 2 SD.

