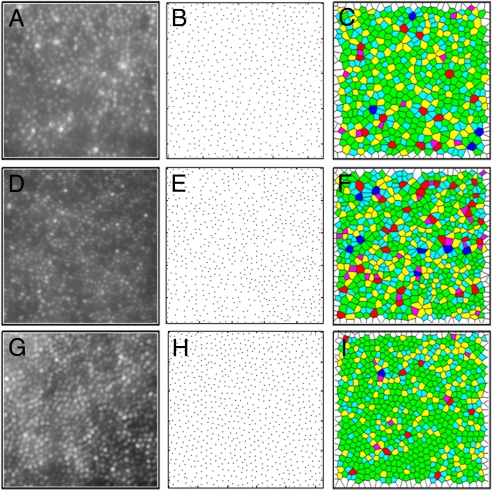
Fig. 4.
Assessing cone mosaic packing geometry. Shown in the left column are retinal images from the right eye of subject 4515 (A), the LIAVA (24) patient (D), and a normal trichromat (G). Shown in the middle column is a plot of cone locations for the corresponding retinal image of subject 4515 (B), the LIAVA patient (E), and a normal trichromat (H). Shown in the right column are the Voronoi domains associated with each cone photoreceptor in subject 4515 (C), the LIAVA patient (F), and a normal trichromat (I). Colors in C, F, and I indicate the number of sides for each Voronoi polygon (magenta = 4, cyan = 5, green = 6, yellow = 7, red = 8, and purple = 9). Large regions of 6-sided polygons indicate a regular triangular lattice (58), whereas other colors mark points of disruptions in the hexagonal packing of the foveal mosaic. While (A) and (D) are from the same retinal eccentricity (1°), the normal mosaic was taken from 1.25° to approximately match cone density.

