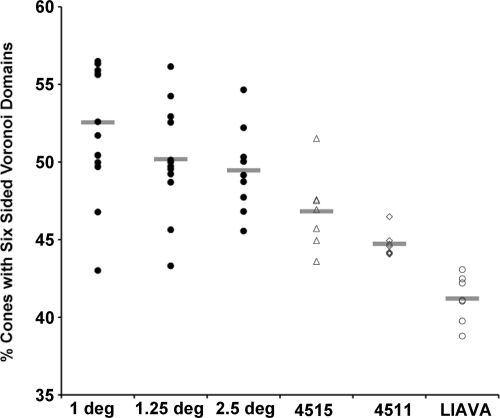
Fig. 5.
Evaluating regularity of the cone mosaic. Plotted is the percentage of cones with 6-sided Voronoi domains for the normal controls as well as the color defective subjects (4511, 4515, and LIAVA). Individual data points for the normals represent individual retinas (n = 15 at 1°, n = 13 at 1.25°, n = 10 at 2.5°), whereas individual data points for the color defective subjects represent measurements at seven different points within the same retina (although all were 1° from the foveal center). Horizontal bars are the mean value for each subject or group of subjects.

