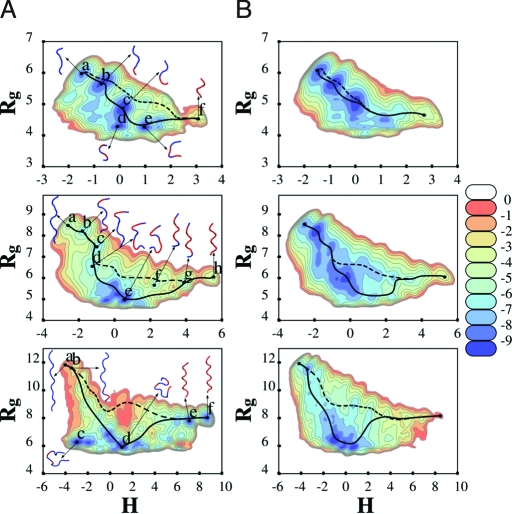
Fig. 2.
Free energy landscapes (kcal/mol) as a function of collective variables (H,R g). Landscapes are shown for a 6-mer (Top), 9-mer (Middle), and 13-mer (Bottom) polyproline peptide: in vacuo (A) and in implicit water (B). Examples of transition paths between PPI and PPII are shown: The solid line passes through the global minimum whereas the dashed line avoids it. A ribbon representation is used for some of the structures associated with some of the major minima, with cis-trans prolyl bonds highlighted in red (blue), respectively. In the 13-mer case, all the prolyl bonds of both E and F structures are cis, but the prolyl amide bond in the amidated terminal of the peptide (not shown) is trans in E and cis in F.

