
Fig. 4.
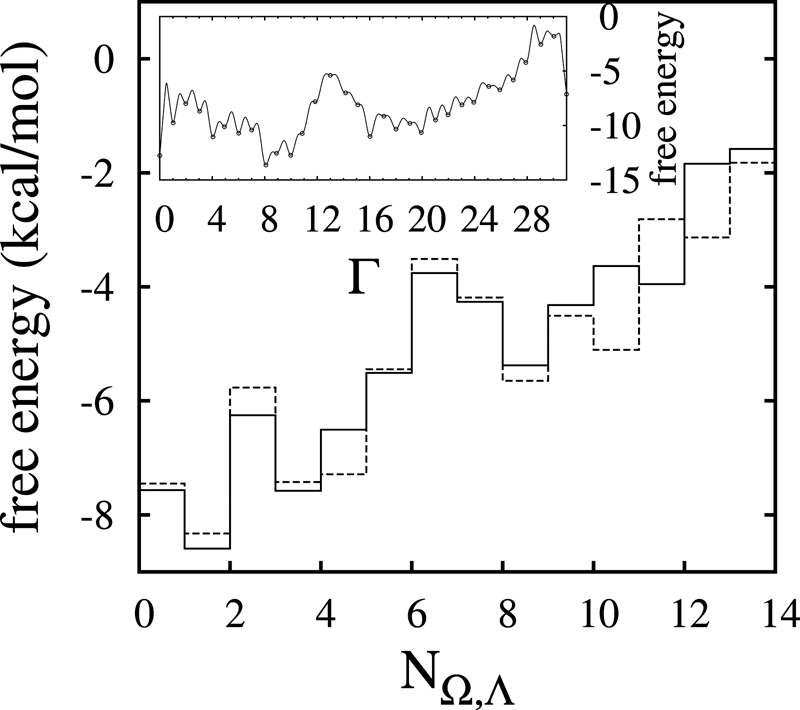
Free energy in the N Ω,Λ representation. The solid line is obtained from the (Ω,Λ) map by enumerating the minima and plotting the corresponding free energy values; the dotted line is obtained by using the Γ results combined with Eq. 6. (Inset). Free energy profile (kcal/mol) of a hexamer polyproline in vacuo, as a function of the single collective variable Γ.