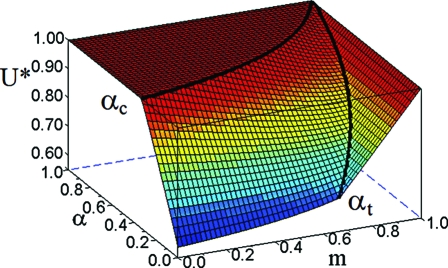
Fig. 3.
Phase diagram of the global utility as a function of the cooperativity α and the asymmetry m, at T → 0 and ρ0 = 1/2. The average utility per agent U* = U/(ρ0 HQ) is calculated by maximizing the potential F(x) for the peaked utility shown in Fig. 2 (see SI Appendix). The plateau at high values of α corresponds to the mixed phase of optimal utility, which is separated from the segregated state by a phase transition arising at αc = 1/(3 − 2m). The overall picture is qualitatively unchanged for low but finite values of the temperature, (see SI Appendix).

