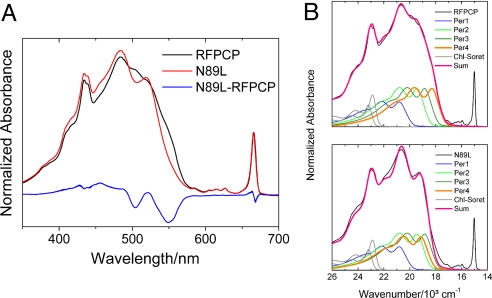
Fig. 4.
(A) Absorption spectra of RFPCP and N89L mutant taken at 10 K. Both spectra were normalized at Qy band. The N89L-RFPCP absorption difference steady-state spectrum (10 K) indicates the most prominent spectral shifts. (B) Reconstruction of the RFPCP and N89L 10-K absorption spectra. RFPCP and N89L are fitted with the same parameters except for Per-4, which is shifted by ≈24 nm and decreased in intensity by ≈8% in the N89L mutant. See text and Origin of the absorption shift in the N89L 10-K absorption spectrum in the SI Text for further details.

