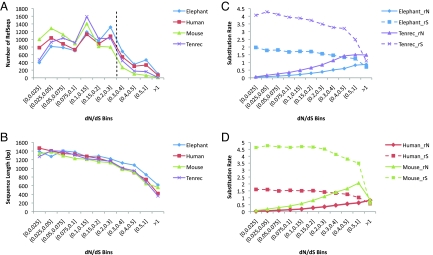
Fig. 2.
Numbers, lengths, and rates of the RefSeqs distributed according to increase in their dN/dS ratios. (A) Number of RefSeqs with given dN/dS ratios for the elephant, human, tenrec, and mouse lineages. Elephant and human have more RefSeqs with elevated dN/dS than tenrec and mouse when dN/dS >0.3 (black dashed line). (B) Length (base pairs) of RefSeqs with given dN/dS ratios for the elephant, human, tenrec, and mouse lineages. Average length of RefSeq decreases as dN/dS increases. (C) Nonsynonymous and synonymous evolution rates (rN and rS, respectively) comparison of elephant and tenrec. Tenrec rN and rS are significantly higher than elephant rN (WST, P < 2.2 × 10⁻¹⁶) and rS (WST, P < 2.2 × 10⁻¹⁶). (D) Nonsynonymous and synonymous evolution rates comparison (rN and rS, respectively) of human and mouse. Mouse rN and rS are significantly higher than human rN (WST, P < 2.2 × 10⁻¹⁶) and rS (WST, P < 2.2 × 10⁻¹⁶).

