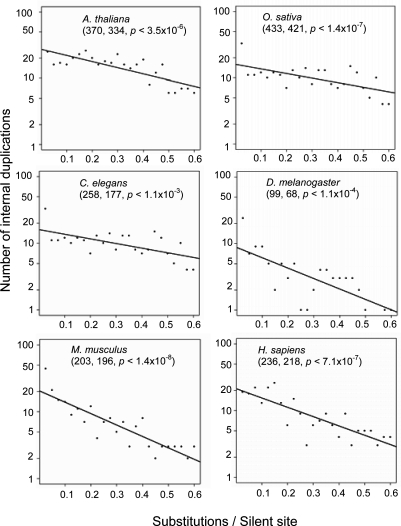
Fig. 1.
Age distributions of internal gene duplications in six eukaryotic genomes based on internal gene duplications for which S < 0.6. Numbers of internal duplications are plotted against their ages (substitutions per silent site). The bin size of the horizontal axis is 0.025 substitutions per silent site. The number of internal duplication events and the number of internally duplicated genes with the S < 0.6 value are listed as the first two numbers in parentheses in each plot. Least-squares regression provides the linear relationship between the natural logarithm of the numbers of internal duplications and their ages, revealing a negative exponential age distribution for the internal duplications. All regressions are significant at the 1% level, and each P value is listed in parentheses in each plot. The fitted parameters are shown in Table 2.

