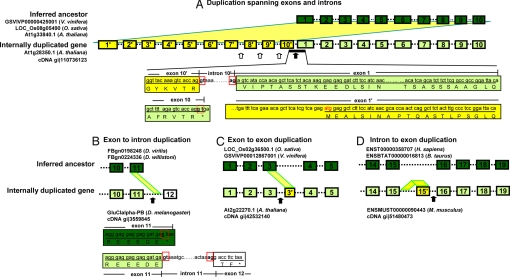
Fig. 2.
Examples of cDNA confirmed introns created by internal gene duplication. Genes with internal duplications and their inferred ancestral genes are shown. (A) Duplication spanning exons and introns. (B) Exon to intron duplication. (C) Exon to exon duplication. (D) Intron to exon duplication. The ancestral genes were inferred from orthologous genes in two out-group species (the IDs of orthologous genes are listed by the referred ancestors) and an internal-duplication-free paralogous gene if available (such as in A). For the purpose of illustration in these examples, the duplicated copy in internally duplicated genes that best aligns with the inferred ancestor gene is considered as the original sequence, and the unaligned duplicated copy is considered derived. Exons and introns are shown with filled boxes and dotted lines, respectively. Exons that are found in both the inferred ancestor (dark green) and the internally duplicated gene (light green) have the same labels. The newly duplicated exons (yellow) are named after the original exon that they were duplicated from, with a prime suffix (e.g., exon 1′ to 10′ in A and exon 3′ in C). Exon 12 in B, filled with white color, is a new exon, but not derived from duplicated sequence directly. Exon 15′ in D is duplicated from sequences located in intron 15. Because of the fast evolution in intron sequences, the intron 15 sequences in internal-duplication-free orthologs (ENST00000358707 in H. sapiens and ENSBTAT00000016813 in B. taurus) do not share significant similarity with intron 15 in the internally duplicated gene (ENSMUST00000090443), nor with the new exon 15′, but the intron and exon in the duplicated gene still show similarity. Duplicated regions are projected as yellow shadows from ancestral genes to derived copies (in A–C), or from an intron of the same gene (in D). Examples of introns created by new splice sites are marked by solid black arrows. Hollow arrows point to examples of new introns created by duplications of preexisting introns. All of these new introns are confirmed by cDNA evidence (GenBank accession numbers are shown). In some cases, the source of the new splice sites can still be identified. The exon–intron boundary sequences around the new splice sites are displayed. In A, all of the exon and intron sequences in the ancestral gene were duplicated. The joining between exon 10′ and exon 1 yielded a new intron sequence: assuming exon 10 represents the last exon in the ancestral gene, the 5′ splice site GT (in a red box) in exon 10′ is activated from a previous latent splice site (G before the stop codon TAA, in a dotted red box) in the ancestral sequence of exon 10. In B, the 5′ splice site GT (a solid red box) is activated from a previous latent splice site (dotted red box) in the exon 11 in the inferred ancestral sequences.

