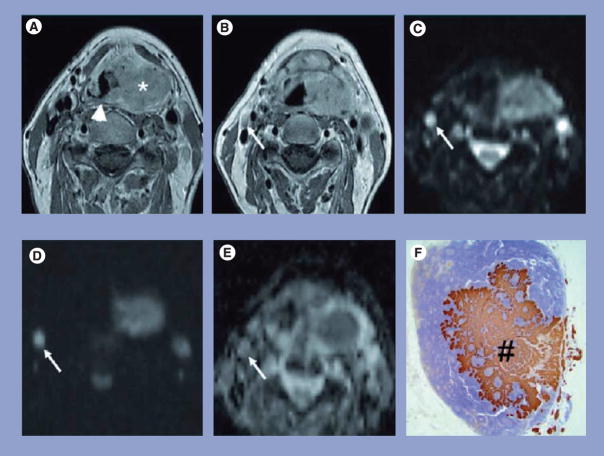
Figure 2. Representative MRI and pathology sections of a squamous cell carcinoma patient with metastatic lymph node.
(A) Transverse gadolinium-enhanced T1-weighted TSE MR image in a 57-year-old man shows a large left-sided tumor mass (*) centered on the piriform sinus involving the supraglottic gland and crossing the midline on the posterior pharyngeal wall (arrowhead). (B) Transverse gadolinium-enhanced T1-weighted TSE MR image from the same patient shows a small oval-shaped lymph node at level 2 on the right side with a shortest transverse diameter of 0.6 cm (arrow); this lymph node was considered to be negative for cancer. (C) The lymph node (arrow) is hyperintense on the b = 0 s/mm2 image. (D) Only a limited signal loss is seen on the b = 1000 s/mm2 DWI image. (E) The ADC map demonstrated the lymph node to have an ADC value of 0.71 × 10⁻³ mm2/s, which was suspicious for metastatic adenopathy. (F) Corresponding prekeratin-stained histopathologic slice shows an intranodal metastatic deposit (#).
ADC: Apparent diffusion coefficient; T1: Spin-lattice relaxation; TSE MR: Turbo spin-echo magnetic resonance.
Reprinted with permission from [25].

