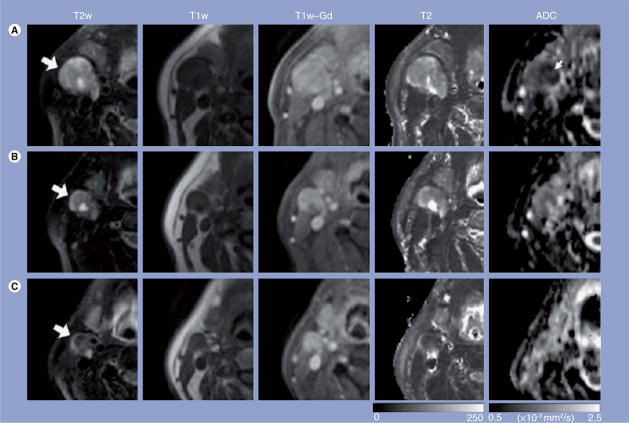
Figure 4. Representative images of a patient who exhibited complete response to treatment.
Images in each row are from three measurement time points: (A) pretreatment, (B) 1 week into chemoradiation therapy and (C) post-treatment. The T2w, T1w and T1w-Gd images were windowed to have similar image contrast, whereas spin–spin relaxation time and ADC images were scaled based on the grayscale bars shown at the bottom of the corresponding images. Large arrows point to the same nodal metastatic mass that was followed through the treatment course; the small arrow (ADC map) shows the central region of the mass with lower ADC values than the peripheral region.
ADC: Apparent diffusion coefficient; T1: Spin-lattice relaxation; T2: Spin–spin relaxation time; T1w: T1-weighted; T1w-Gd: T1-weighted postcontrast enhanced; T2w: T2-weighted.
Reprinted with permission from [29].

