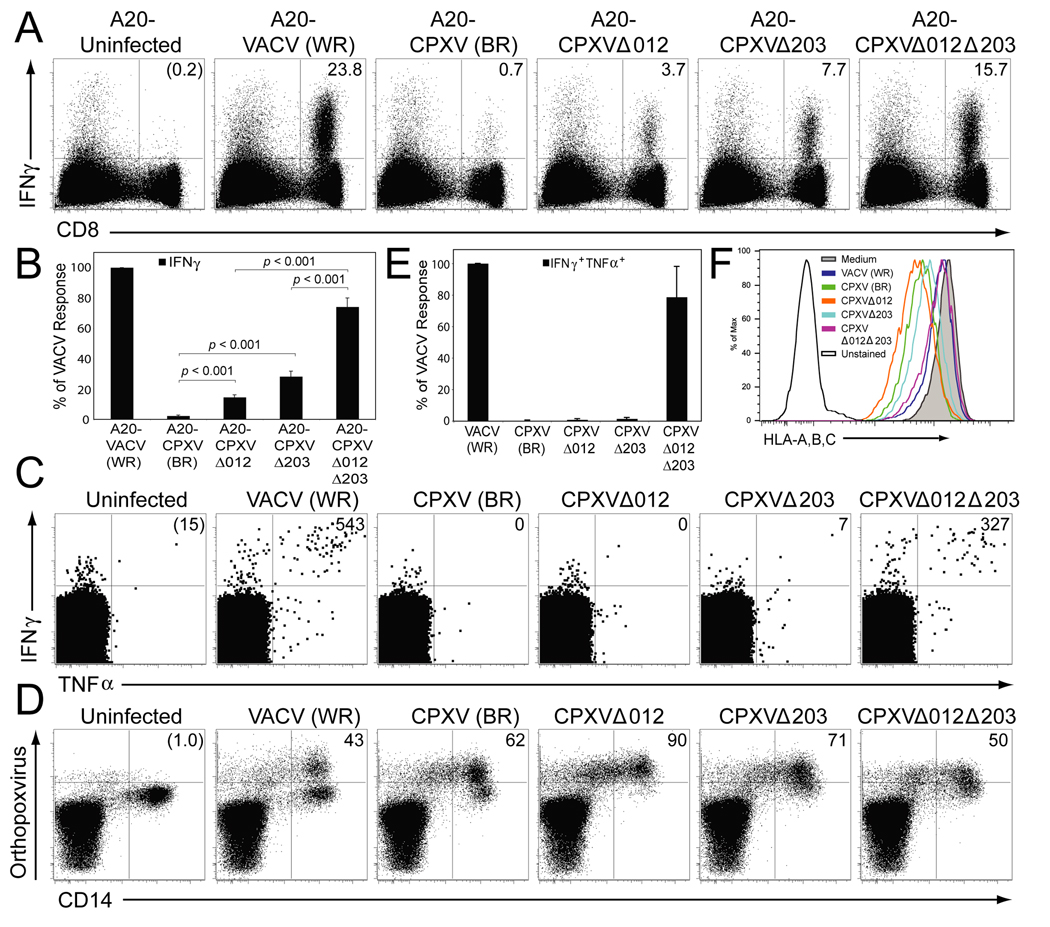
Figure 4. CD8+ T cell activation by CPXV is restored upon deletion of both CPXV012 and CPXV203.
(A) The antiviral CD8+ T cell response in BALB/c mice measured by ICCS. Splenocytes (8 dpi) were incubated with uninfected A20 cells, or infected with the indicated viruses. The percentage of IFNγ producing CD8+ T cells (upper right quadrant) was determined after background subtraction (uninfected control). (B) The average CD8+ T cell response of 6 mice was determined by ICCS and normalized to 100% based on the response to VACV. The data are representative of 2 experiments with 3 mice per group. Statistical differences were calculated using the 2-tailed paired Student t-test. (C) Human virus-specific CD8+ T cell responses in the presence of indicated viruses. PBMC of VACV-immune subjects were gated on CD8+CD4− T cells and the number of IFNγ +TNFα+CD8+ T cells per 106 CD8+ T cells (upper right quadrant) was determined after background subtraction (uninfected control). The CD8+ T cell responses from a representative subject at 2 months after VACV infection is shown. D) The number of virus-infected CD14+ monocytes in a representative PBMC sample at 16 hpi was determined by staining with polyclonal antibodies against OPXV antigens. The numbers in the upper right quadrants represent the percentage of virus-infected CD14+ cells after background subtraction (uninfected). (E) The average antiviral CD8+ T cell response from 4 subjects determined by ICCS at 2 months post-VACV infection and normalized to 100% based on the response to VACV. (F) HLA-A, B, C-expression on virus-infected primary CD14+ monocytes at 16 h p.i.. Monocytes were identified based on forward and side scatter characteristics and CD14 expression.

