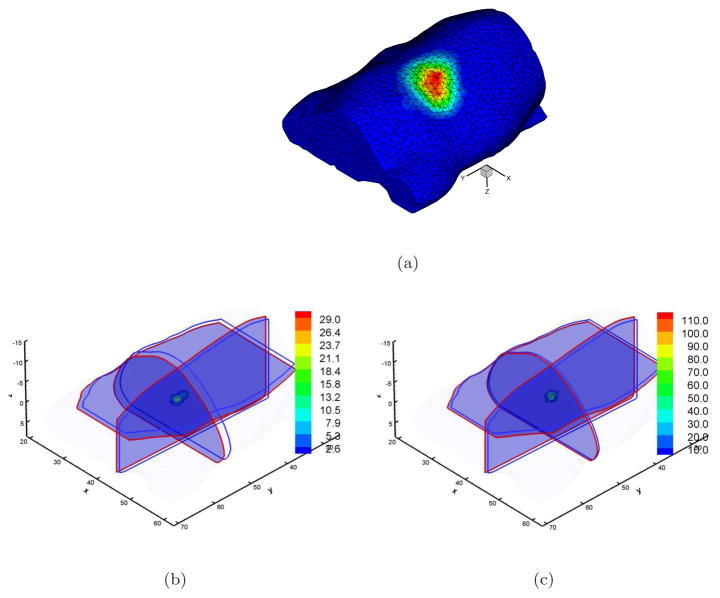
Figure 7.
Single view experimental BLT reconstructions with DA- and SP3-based algorithms. Figures (a) shows the volumetric mesh and the mapped photon distribution. Figures (b) and (c) are the reconstructed results corresponding to DA and SP3 methods. Cross-sections with blue and red boundaries are the center position of actual and reconstructed sources respectively. Volumetric mesh denotes the reconstructed values larger than 10% of the reconstructed maximum.

