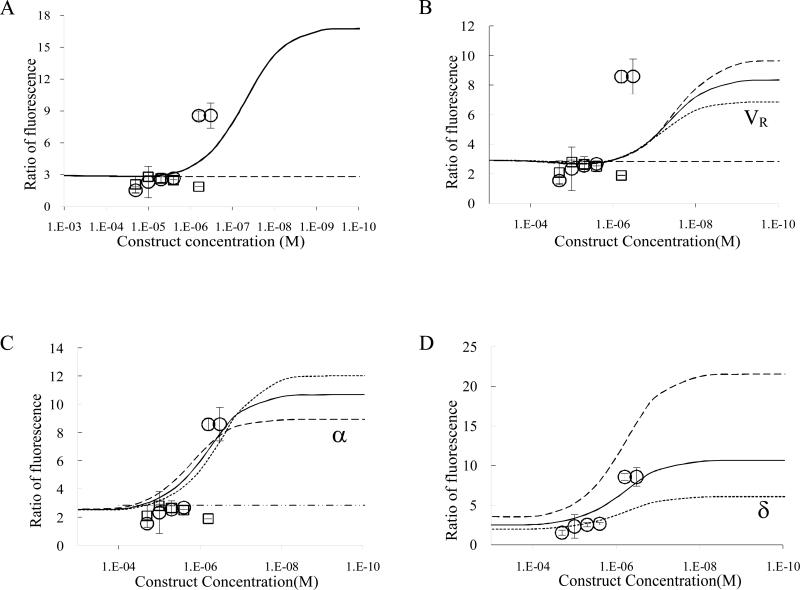
Figure 3.
Ratio of fluorescence as a measure of binding specificity of trivalent construct (circles) and dodecapeptide (squares). (A) Continuous lines depict theoretical binding specificity of the trivalent construct (solid line) and monovalent construct (dashed line) fit for VR,. Error bars depict 95% confidence intervals. (B) VR is set so that the plateau of maximal specificity equals the specificity of the measured value at the lowest concentration. Sensitivity analysis for VR is included –increased (long dash) or decreased (short dash) by 30%. (C) Sensitivity analysis for α as it was increased (long dash) or decreased (short dash) to the bounds of the 95% confidence interval of the measured values and best fit to data (thick solid). (D) Sensitivity analysis for δ (over-expression ratio) as it was increased (long dash) or decreased (short dash) to the bounds of the 95% confidence interval of the measured values.

