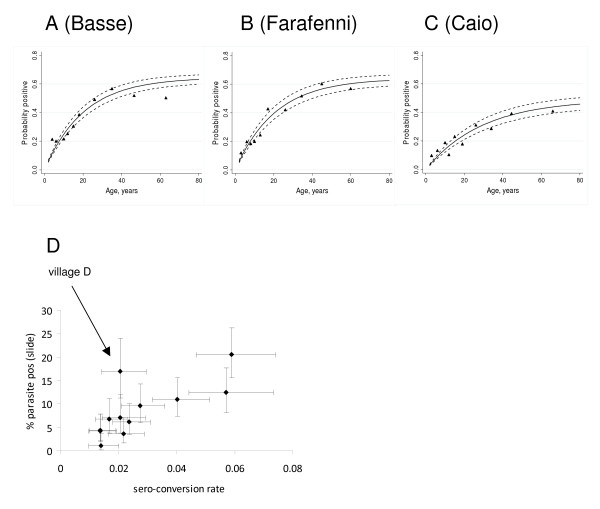
Figure 2.
Continuous increase of MSP-119 antibody sero-prevalence with age. A-C) For each site the sero-prevalence of anti-MSP-119 antibodies is shown according to age. Triangles represent the observed values, the continuous line shows the values predicted by the catalytic conversion model [17] with 95%

