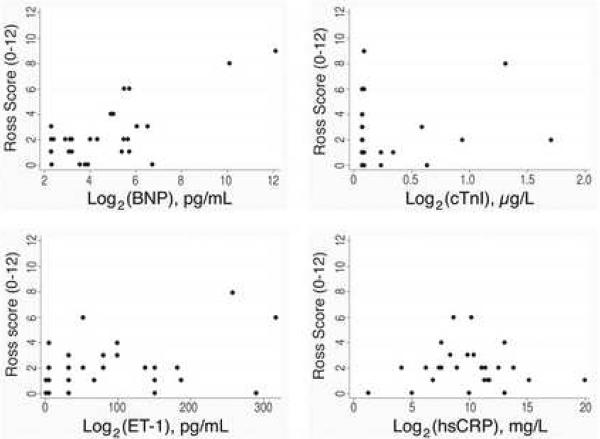
Figure 1. Scatter plots of biomarkers versus Ross scores.
Scatter plots of plasma protein concentrations versus raw Ross scores in 29 single ventricle patients. Log2 transformation of BNP revealed a roughly linear relationship with raw Ross score, while this was not the case for the other plasma proteins studied.

