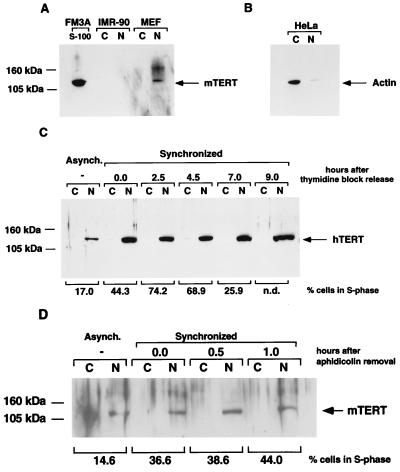
Figure 7.
Cell cycle regulation of TERT protein. (A) Fifty micrograms of either nuclear (N) or cytoplasmic (C) extracts from asynchronous populations of IMR-90 and MEFs were analyzed by Western blotting using K-370 antibodies. mTERT was detected exclusively in the nucleus of the MEFs. (B) Fifty micrograms of either nuclear (N) or cytoplasmic (C) extracts from asynchronous HeLa cells were analyzed by Western blotting using anti-actin antibodies. The cytoplasmic fraction showed the actin band. (C) Western blot analysis, using K-370 antibodies, of nuclear (N) and cytoplasmic (C) extracts from asynchronous or synchronized HeLa cells at the indicated times after the thymidine block release. Fifty micrograms of total protein was loaded per lane. The percentage of cells in S phase at the different points analyzed is also indicated. (D) Western blot analysis, using K-370 antibodies, of nuclear (N) and cytoplasmic (C) extracts from asynchronous or synchronized MEFs at the indicated times after the aphidicolin block release. One hundred micrograms of total protein was loaded per lane. The percentage of cells in S phase at the indicated different points analyzed is also shown.

